Ethiopian vs Immigrants from Ecuador Unemployment Among Ages 20 to 24 years
COMPARE
Ethiopian
Immigrants from Ecuador
Unemployment Among Ages 20 to 24 years
Unemployment Among Ages 20 to 24 years Comparison
Ethiopians
Immigrants from Ecuador
9.8%
UNEMPLOYMENT AMONG AGES 20 TO 24 YEARS
99.7/ 100
METRIC RATING
51st/ 347
METRIC RANK
11.8%
UNEMPLOYMENT AMONG AGES 20 TO 24 YEARS
0.0/ 100
METRIC RATING
287th/ 347
METRIC RANK
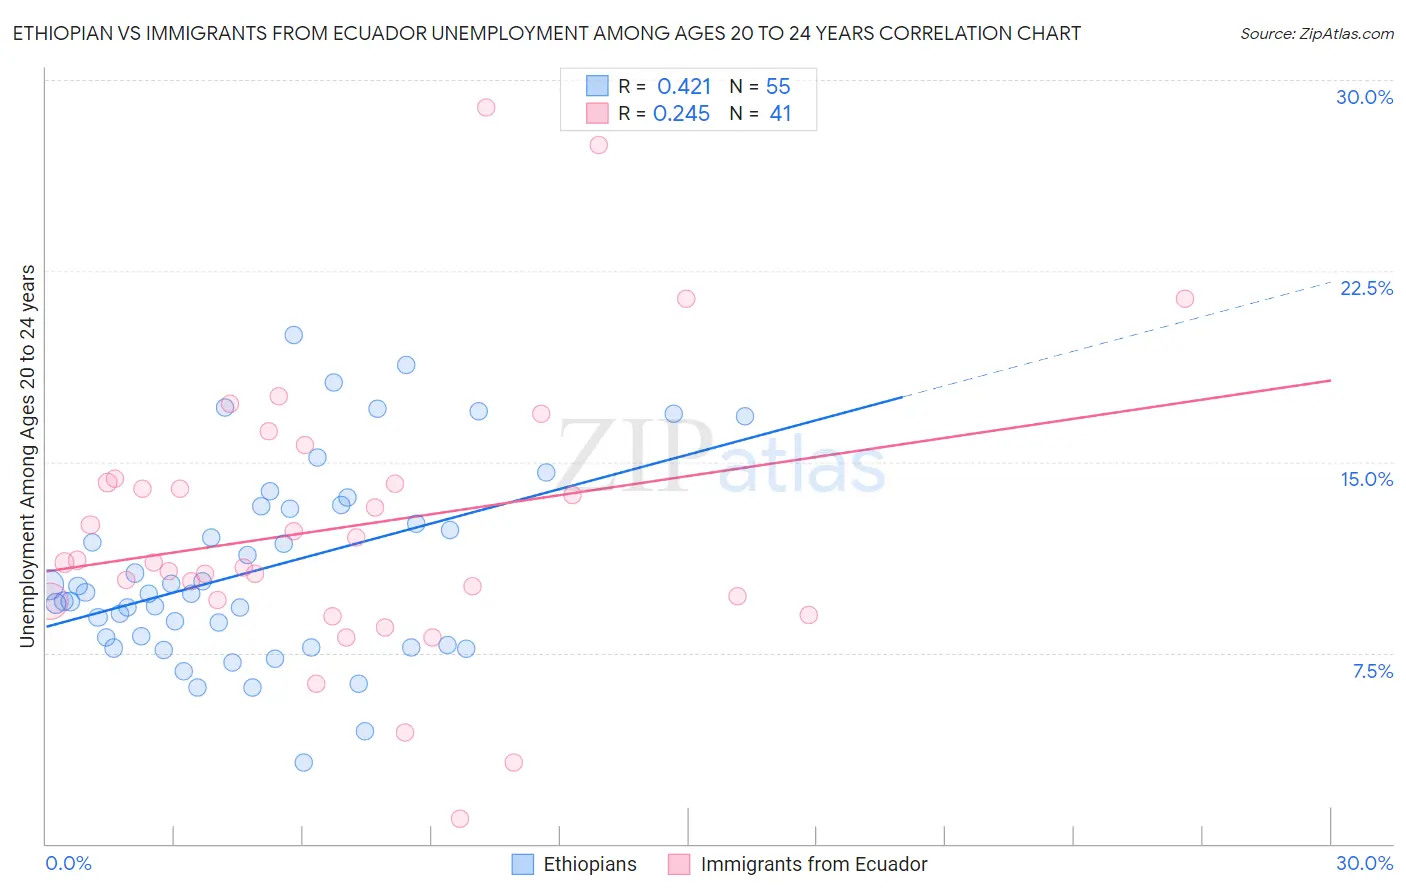
Ethiopian vs Immigrants from Ecuador Unemployment Among Ages 20 to 24 years Correlation Chart
The statistical analysis conducted on geographies consisting of 220,623,772 people shows a moderate positive correlation between the proportion of Ethiopians and unemployment rate among population between the ages 20 and 24 in the United States with a correlation coefficient (R) of 0.421 and weighted average of 9.8%. Similarly, the statistical analysis conducted on geographies consisting of 266,640,258 people shows a weak positive correlation between the proportion of Immigrants from Ecuador and unemployment rate among population between the ages 20 and 24 in the United States with a correlation coefficient (R) of 0.245 and weighted average of 11.8%, a difference of 20.6%.
Unemployment Among Ages 20 to 24 years Correlation Summary
| Measurement | Ethiopian | Immigrants from Ecuador |
| Minimum | 3.2% | 1.0% |
| Maximum | 20.0% | 28.9% |
| Range | 16.8% | 27.9% |
| Mean | 10.8% | 12.4% |
| Median | 9.8% | 11.0% |
| Interquartile 25% (IQ1) | 7.8% | 9.6% |
| Interquartile 75% (IQ3) | 13.3% | 14.3% |
| Interquartile Range (IQR) | 5.5% | 4.7% |
| Standard Deviation (Sample) | 3.8% | 5.5% |
| Standard Deviation (Population) | 3.8% | 5.5% |
Similar Demographics by Unemployment Among Ages 20 to 24 years
Demographics Similar to Ethiopians by Unemployment Among Ages 20 to 24 years
In terms of unemployment among ages 20 to 24 years, the demographic groups most similar to Ethiopians are Immigrants from Kenya (9.7%, a difference of 0.070%), Immigrants from Thailand (9.8%, a difference of 0.11%), Creek (9.7%, a difference of 0.21%), Immigrants from Serbia (9.8%, a difference of 0.22%), and Immigrants from Cambodia (9.8%, a difference of 0.26%).
| Demographics | Rating | Rank | Unemployment Among Ages 20 to 24 years |
| Europeans | 99.8 /100 | #44 | Exceptional 9.7% |
| Croatians | 99.8 /100 | #45 | Exceptional 9.7% |
| Immigrants | Nicaragua | 99.8 /100 | #46 | Exceptional 9.7% |
| Immigrants | India | 99.8 /100 | #47 | Exceptional 9.7% |
| Finns | 99.8 /100 | #48 | Exceptional 9.7% |
| Creek | 99.8 /100 | #49 | Exceptional 9.7% |
| Immigrants | Kenya | 99.7 /100 | #50 | Exceptional 9.7% |
| Ethiopians | 99.7 /100 | #51 | Exceptional 9.8% |
| Immigrants | Thailand | 99.7 /100 | #52 | Exceptional 9.8% |
| Immigrants | Serbia | 99.6 /100 | #53 | Exceptional 9.8% |
| Immigrants | Cambodia | 99.6 /100 | #54 | Exceptional 9.8% |
| Carpatho Rusyns | 99.6 /100 | #55 | Exceptional 9.8% |
| Nicaraguans | 99.6 /100 | #56 | Exceptional 9.8% |
| Immigrants | Moldova | 99.5 /100 | #57 | Exceptional 9.8% |
| Pakistanis | 99.5 /100 | #58 | Exceptional 9.8% |
Demographics Similar to Immigrants from Ecuador by Unemployment Among Ages 20 to 24 years
In terms of unemployment among ages 20 to 24 years, the demographic groups most similar to Immigrants from Ecuador are U.S. Virgin Islander (11.8%, a difference of 0.050%), Ecuadorian (11.8%, a difference of 0.090%), Soviet Union (11.7%, a difference of 0.21%), Immigrants from Western Africa (11.7%, a difference of 0.25%), and Ghanaian (11.7%, a difference of 0.26%).
| Demographics | Rating | Rank | Unemployment Among Ages 20 to 24 years |
| Alaskan Athabascans | 0.0 /100 | #280 | Tragic 11.6% |
| Armenians | 0.0 /100 | #281 | Tragic 11.7% |
| Immigrants | Cameroon | 0.0 /100 | #282 | Tragic 11.7% |
| Ghanaians | 0.0 /100 | #283 | Tragic 11.7% |
| Immigrants | Western Africa | 0.0 /100 | #284 | Tragic 11.7% |
| Soviet Union | 0.0 /100 | #285 | Tragic 11.7% |
| Ecuadorians | 0.0 /100 | #286 | Tragic 11.8% |
| Immigrants | Ecuador | 0.0 /100 | #287 | Tragic 11.8% |
| U.S. Virgin Islanders | 0.0 /100 | #288 | Tragic 11.8% |
| Belizeans | 0.0 /100 | #289 | Tragic 11.8% |
| Immigrants | Caribbean | 0.0 /100 | #290 | Tragic 11.8% |
| Central American Indians | 0.0 /100 | #291 | Tragic 11.9% |
| Immigrants | Senegal | 0.0 /100 | #292 | Tragic 11.9% |
| Immigrants | Ghana | 0.0 /100 | #293 | Tragic 11.9% |
| Immigrants | Belize | 0.0 /100 | #294 | Tragic 12.0% |