Ethiopian vs Immigrants from Costa Rica Unemployment Among Ages 20 to 24 years
COMPARE
Ethiopian
Immigrants from Costa Rica
Unemployment Among Ages 20 to 24 years
Unemployment Among Ages 20 to 24 years Comparison
Ethiopians
Immigrants from Costa Rica
9.8%
UNEMPLOYMENT AMONG AGES 20 TO 24 YEARS
99.7/ 100
METRIC RATING
51st/ 347
METRIC RANK
10.6%
UNEMPLOYMENT AMONG AGES 20 TO 24 YEARS
4.9/ 100
METRIC RATING
226th/ 347
METRIC RANK
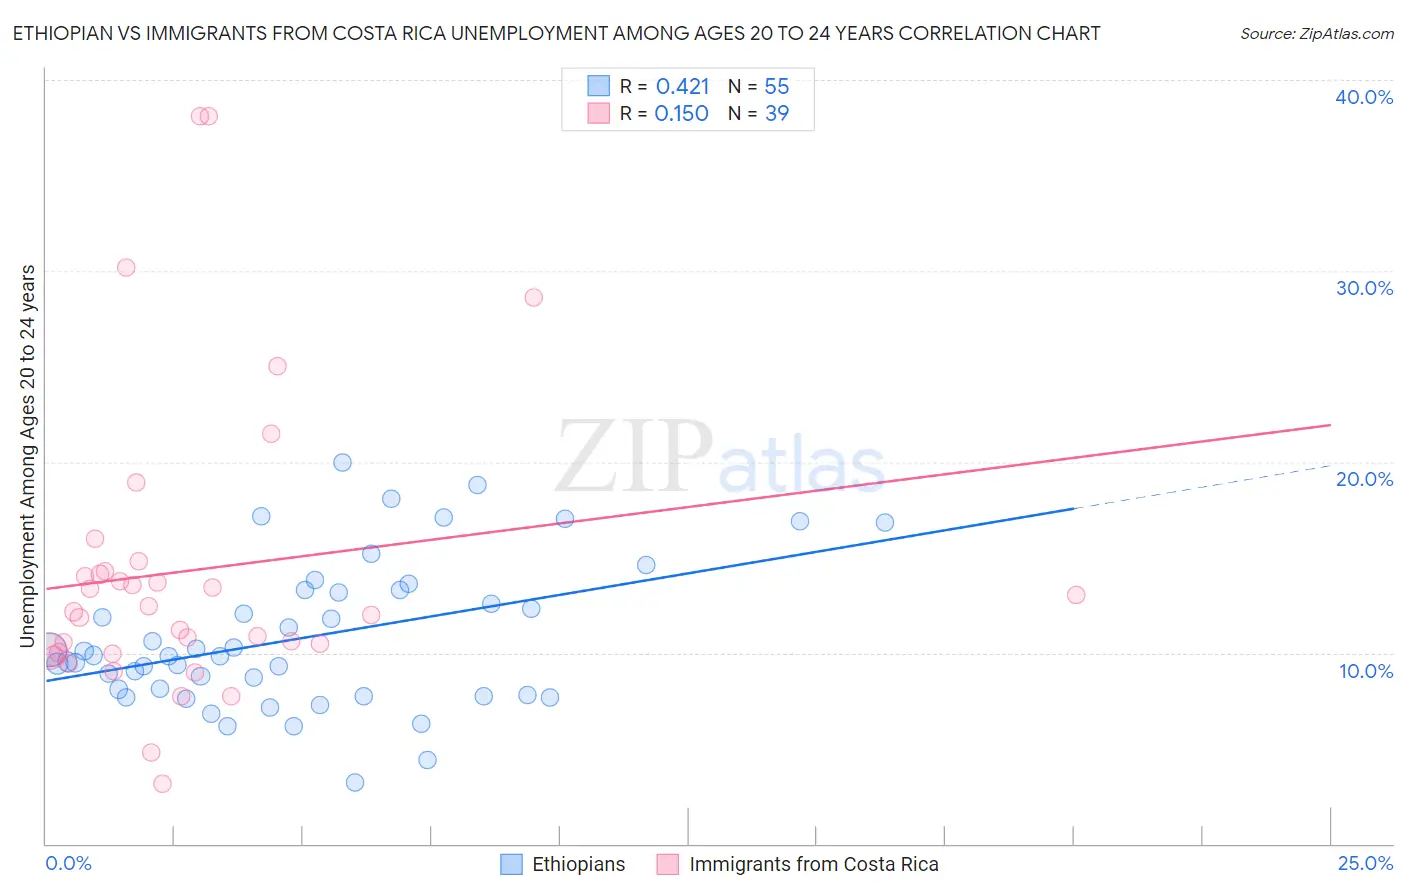
Ethiopian vs Immigrants from Costa Rica Unemployment Among Ages 20 to 24 years Correlation Chart
The statistical analysis conducted on geographies consisting of 220,623,772 people shows a moderate positive correlation between the proportion of Ethiopians and unemployment rate among population between the ages 20 and 24 in the United States with a correlation coefficient (R) of 0.421 and weighted average of 9.8%. Similarly, the statistical analysis conducted on geographies consisting of 201,666,551 people shows a poor positive correlation between the proportion of Immigrants from Costa Rica and unemployment rate among population between the ages 20 and 24 in the United States with a correlation coefficient (R) of 0.150 and weighted average of 10.6%, a difference of 8.5%.
Unemployment Among Ages 20 to 24 years Correlation Summary
| Measurement | Ethiopian | Immigrants from Costa Rica |
| Minimum | 3.2% | 3.2% |
| Maximum | 20.0% | 38.1% |
| Range | 16.8% | 34.9% |
| Mean | 10.8% | 14.3% |
| Median | 9.8% | 12.1% |
| Interquartile 25% (IQ1) | 7.8% | 10.0% |
| Interquartile 75% (IQ3) | 13.3% | 14.3% |
| Interquartile Range (IQR) | 5.5% | 4.3% |
| Standard Deviation (Sample) | 3.8% | 7.8% |
| Standard Deviation (Population) | 3.8% | 7.7% |
Similar Demographics by Unemployment Among Ages 20 to 24 years
Demographics Similar to Ethiopians by Unemployment Among Ages 20 to 24 years
In terms of unemployment among ages 20 to 24 years, the demographic groups most similar to Ethiopians are Immigrants from Kenya (9.7%, a difference of 0.070%), Immigrants from Thailand (9.8%, a difference of 0.11%), Creek (9.7%, a difference of 0.21%), Immigrants from Serbia (9.8%, a difference of 0.22%), and Immigrants from Cambodia (9.8%, a difference of 0.26%).
| Demographics | Rating | Rank | Unemployment Among Ages 20 to 24 years |
| Europeans | 99.8 /100 | #44 | Exceptional 9.7% |
| Croatians | 99.8 /100 | #45 | Exceptional 9.7% |
| Immigrants | Nicaragua | 99.8 /100 | #46 | Exceptional 9.7% |
| Immigrants | India | 99.8 /100 | #47 | Exceptional 9.7% |
| Finns | 99.8 /100 | #48 | Exceptional 9.7% |
| Creek | 99.8 /100 | #49 | Exceptional 9.7% |
| Immigrants | Kenya | 99.7 /100 | #50 | Exceptional 9.7% |
| Ethiopians | 99.7 /100 | #51 | Exceptional 9.8% |
| Immigrants | Thailand | 99.7 /100 | #52 | Exceptional 9.8% |
| Immigrants | Serbia | 99.6 /100 | #53 | Exceptional 9.8% |
| Immigrants | Cambodia | 99.6 /100 | #54 | Exceptional 9.8% |
| Carpatho Rusyns | 99.6 /100 | #55 | Exceptional 9.8% |
| Nicaraguans | 99.6 /100 | #56 | Exceptional 9.8% |
| Immigrants | Moldova | 99.5 /100 | #57 | Exceptional 9.8% |
| Pakistanis | 99.5 /100 | #58 | Exceptional 9.8% |
Demographics Similar to Immigrants from Costa Rica by Unemployment Among Ages 20 to 24 years
In terms of unemployment among ages 20 to 24 years, the demographic groups most similar to Immigrants from Costa Rica are Palestinian (10.6%, a difference of 0.0%), Immigrants from South America (10.6%, a difference of 0.030%), Nepalese (10.6%, a difference of 0.040%), Mexican American Indian (10.6%, a difference of 0.070%), and American (10.6%, a difference of 0.11%).
| Demographics | Rating | Rank | Unemployment Among Ages 20 to 24 years |
| Immigrants | Southern Europe | 8.0 /100 | #219 | Tragic 10.5% |
| Eastern Europeans | 6.9 /100 | #220 | Tragic 10.6% |
| Central Americans | 6.8 /100 | #221 | Tragic 10.6% |
| Immigrants | Poland | 6.4 /100 | #222 | Tragic 10.6% |
| Arabs | 5.6 /100 | #223 | Tragic 10.6% |
| Nepalese | 5.1 /100 | #224 | Tragic 10.6% |
| Immigrants | South America | 5.1 /100 | #225 | Tragic 10.6% |
| Immigrants | Costa Rica | 4.9 /100 | #226 | Tragic 10.6% |
| Palestinians | 4.9 /100 | #227 | Tragic 10.6% |
| Mexican American Indians | 4.6 /100 | #228 | Tragic 10.6% |
| Americans | 4.4 /100 | #229 | Tragic 10.6% |
| French American Indians | 4.1 /100 | #230 | Tragic 10.6% |
| Native Hawaiians | 3.9 /100 | #231 | Tragic 10.6% |
| Israelis | 3.7 /100 | #232 | Tragic 10.6% |
| Choctaw | 3.6 /100 | #233 | Tragic 10.6% |