Ethiopian vs Immigrants from Ecuador 6th Grade
COMPARE
Ethiopian
Immigrants from Ecuador
6th Grade
6th Grade Comparison
Ethiopians
Immigrants from Ecuador
96.6%
6TH GRADE
1.5/ 100
METRIC RATING
244th/ 347
METRIC RANK
95.3%
6TH GRADE
0.0/ 100
METRIC RATING
320th/ 347
METRIC RANK
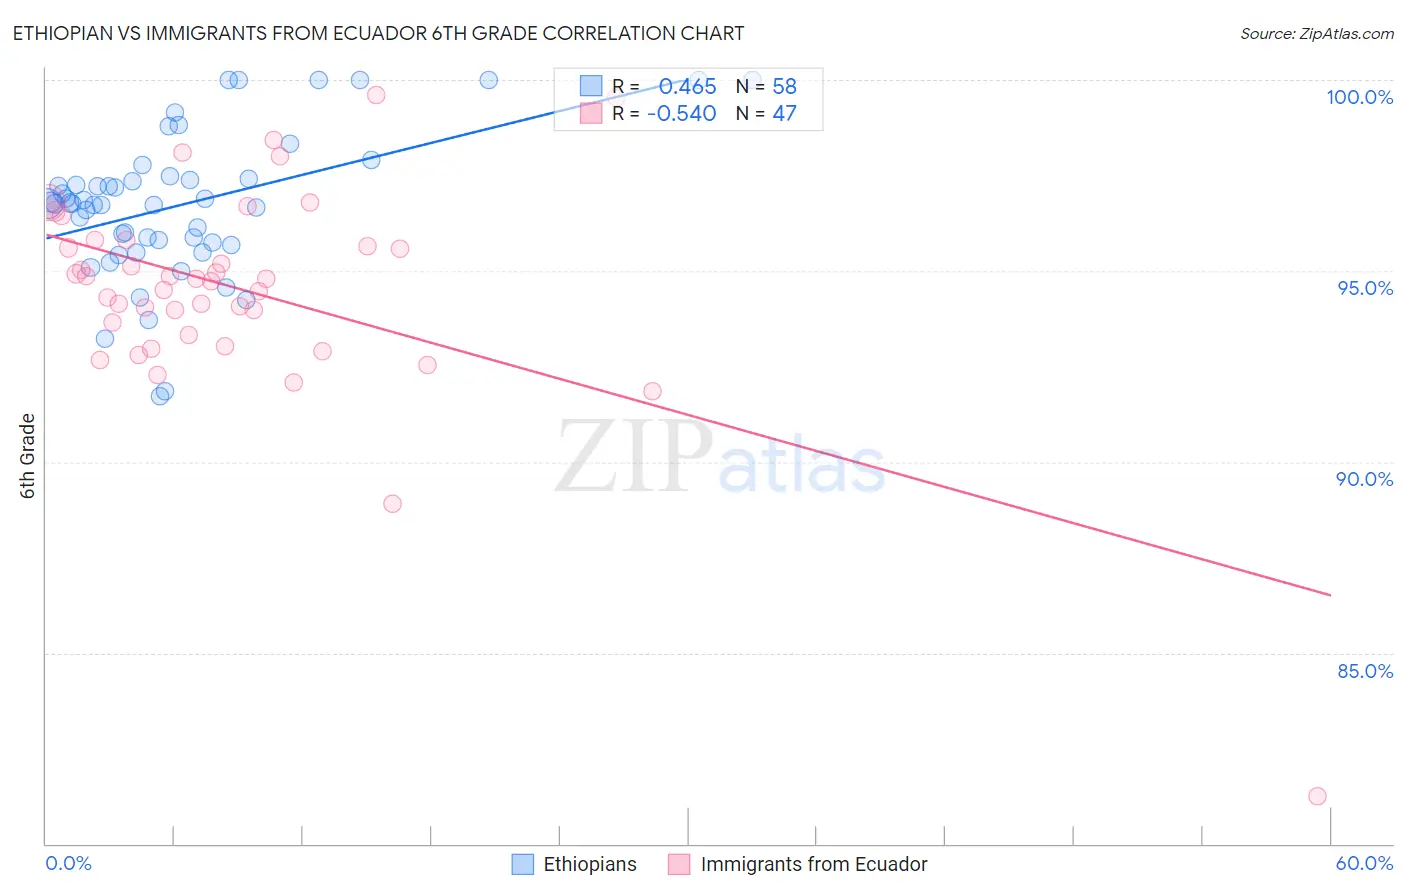
Ethiopian vs Immigrants from Ecuador 6th Grade Correlation Chart
The statistical analysis conducted on geographies consisting of 223,120,541 people shows a moderate positive correlation between the proportion of Ethiopians and percentage of population with at least 6th grade education in the United States with a correlation coefficient (R) of 0.465 and weighted average of 96.6%. Similarly, the statistical analysis conducted on geographies consisting of 271,020,679 people shows a substantial negative correlation between the proportion of Immigrants from Ecuador and percentage of population with at least 6th grade education in the United States with a correlation coefficient (R) of -0.540 and weighted average of 95.3%, a difference of 1.4%.
6th Grade Correlation Summary
| Measurement | Ethiopian | Immigrants from Ecuador |
| Minimum | 91.7% | 81.2% |
| Maximum | 100.0% | 99.6% |
| Range | 8.3% | 18.3% |
| Mean | 96.7% | 94.5% |
| Median | 96.8% | 94.8% |
| Interquartile 25% (IQ1) | 95.7% | 93.3% |
| Interquartile 75% (IQ3) | 97.4% | 95.8% |
| Interquartile Range (IQR) | 1.7% | 2.5% |
| Standard Deviation (Sample) | 1.9% | 2.8% |
| Standard Deviation (Population) | 1.9% | 2.8% |
Similar Demographics by 6th Grade
Demographics Similar to Ethiopians by 6th Grade
In terms of 6th grade, the demographic groups most similar to Ethiopians are Immigrants from Liberia (96.6%, a difference of 0.010%), Senegalese (96.6%, a difference of 0.020%), Immigrants from Asia (96.6%, a difference of 0.020%), Immigrants from Costa Rica (96.6%, a difference of 0.020%), and Immigrants from Africa (96.6%, a difference of 0.020%).
| Demographics | Rating | Rank | 6th Grade |
| Immigrants | Eastern Africa | 2.0 /100 | #237 | Tragic 96.6% |
| Nigerians | 1.9 /100 | #238 | Tragic 96.6% |
| Indians (Asian) | 1.9 /100 | #239 | Tragic 96.6% |
| Koreans | 1.9 /100 | #240 | Tragic 96.6% |
| Senegalese | 1.8 /100 | #241 | Tragic 96.6% |
| Immigrants | Asia | 1.8 /100 | #242 | Tragic 96.6% |
| Immigrants | Liberia | 1.6 /100 | #243 | Tragic 96.6% |
| Ethiopians | 1.5 /100 | #244 | Tragic 96.6% |
| Immigrants | Costa Rica | 1.3 /100 | #245 | Tragic 96.6% |
| Immigrants | Africa | 1.3 /100 | #246 | Tragic 96.6% |
| Bolivians | 1.0 /100 | #247 | Tragic 96.5% |
| Tohono O'odham | 1.0 /100 | #248 | Tragic 96.5% |
| Colombians | 0.9 /100 | #249 | Tragic 96.5% |
| Immigrants | Middle Africa | 0.8 /100 | #250 | Tragic 96.5% |
| Immigrants | Senegal | 0.7 /100 | #251 | Tragic 96.5% |
Demographics Similar to Immigrants from Ecuador by 6th Grade
In terms of 6th grade, the demographic groups most similar to Immigrants from Ecuador are Immigrants from Belize (95.3%, a difference of 0.030%), Belizean (95.3%, a difference of 0.040%), Vietnamese (95.3%, a difference of 0.060%), Immigrants from Fiji (95.2%, a difference of 0.060%), and Japanese (95.4%, a difference of 0.10%).
| Demographics | Rating | Rank | 6th Grade |
| Nicaraguans | 0.0 /100 | #313 | Tragic 95.4% |
| Immigrants | Vietnam | 0.0 /100 | #314 | Tragic 95.4% |
| Immigrants | Bangladesh | 0.0 /100 | #315 | Tragic 95.4% |
| Japanese | 0.0 /100 | #316 | Tragic 95.4% |
| Vietnamese | 0.0 /100 | #317 | Tragic 95.3% |
| Belizeans | 0.0 /100 | #318 | Tragic 95.3% |
| Immigrants | Belize | 0.0 /100 | #319 | Tragic 95.3% |
| Immigrants | Ecuador | 0.0 /100 | #320 | Tragic 95.3% |
| Immigrants | Fiji | 0.0 /100 | #321 | Tragic 95.2% |
| Immigrants | Cambodia | 0.0 /100 | #322 | Tragic 95.2% |
| Central American Indians | 0.0 /100 | #323 | Tragic 95.1% |
| Cape Verdeans | 0.0 /100 | #324 | Tragic 95.1% |
| Immigrants | Nicaragua | 0.0 /100 | #325 | Tragic 95.1% |
| Hispanics or Latinos | 0.0 /100 | #326 | Tragic 95.0% |
| Mexican American Indians | 0.0 /100 | #327 | Tragic 95.0% |