Carpatho Rusyn vs Bermudan Unemployment Among Seniors over 75 years
COMPARE
Carpatho Rusyn
Bermudan
Unemployment Among Seniors over 75 years
Unemployment Among Seniors over 75 years Comparison
Carpatho Rusyns
Bermudans
9.7%
UNEMPLOYMENT AMONG SENIORS OVER 75 YEARS
0.0/ 100
METRIC RATING
285th/ 347
METRIC RANK
8.9%
UNEMPLOYMENT AMONG SENIORS OVER 75 YEARS
15.0/ 100
METRIC RATING
210th/ 347
METRIC RANK
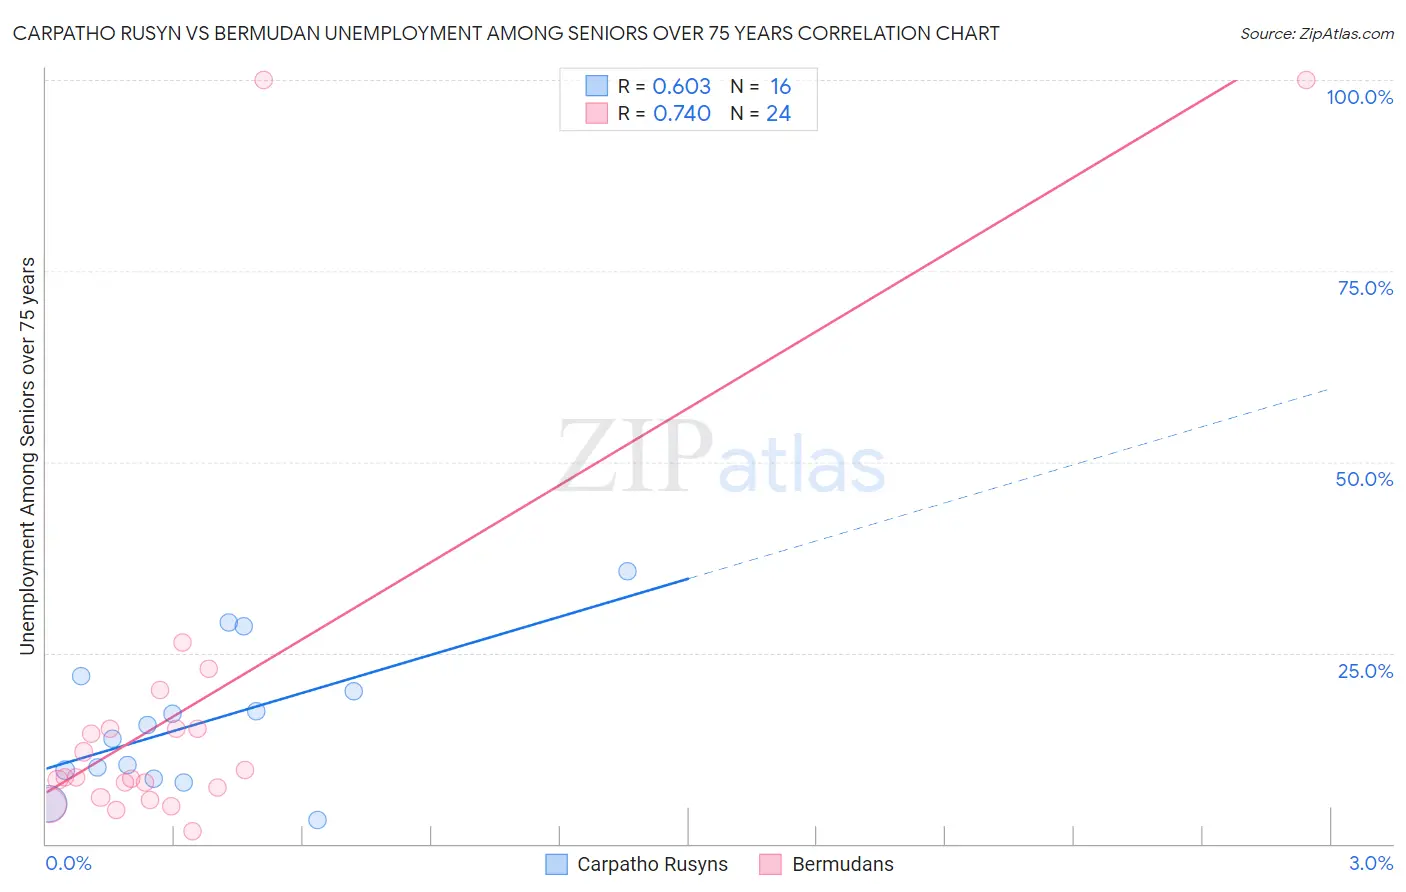
Carpatho Rusyn vs Bermudan Unemployment Among Seniors over 75 years Correlation Chart
The statistical analysis conducted on geographies consisting of 46,670,878 people shows a significant positive correlation between the proportion of Carpatho Rusyns and unemployment rate among seniors over the age of 75 in the United States with a correlation coefficient (R) of 0.603 and weighted average of 9.7%. Similarly, the statistical analysis conducted on geographies consisting of 46,839,817 people shows a strong positive correlation between the proportion of Bermudans and unemployment rate among seniors over the age of 75 in the United States with a correlation coefficient (R) of 0.740 and weighted average of 8.9%, a difference of 8.0%.
Unemployment Among Seniors over 75 years Correlation Summary
| Measurement | Carpatho Rusyn | Bermudan |
| Minimum | 3.1% | 1.6% |
| Maximum | 35.7% | 100.0% |
| Range | 32.6% | 98.4% |
| Mean | 15.8% | 18.2% |
| Median | 14.6% | 8.7% |
| Interquartile 25% (IQ1) | 9.1% | 6.7% |
| Interquartile 75% (IQ3) | 20.9% | 15.1% |
| Interquartile Range (IQR) | 11.9% | 8.3% |
| Standard Deviation (Sample) | 9.2% | 25.9% |
| Standard Deviation (Population) | 9.0% | 25.4% |
Similar Demographics by Unemployment Among Seniors over 75 years
Demographics Similar to Carpatho Rusyns by Unemployment Among Seniors over 75 years
In terms of unemployment among seniors over 75 years, the demographic groups most similar to Carpatho Rusyns are European (9.7%, a difference of 0.030%), Nigerian (9.7%, a difference of 0.060%), Danish (9.7%, a difference of 0.17%), Immigrants from Nigeria (9.6%, a difference of 0.24%), and Macedonian (9.6%, a difference of 0.28%).
| Demographics | Rating | Rank | Unemployment Among Seniors over 75 years |
| Immigrants | Senegal | 0.1 /100 | #278 | Tragic 9.6% |
| British | 0.1 /100 | #279 | Tragic 9.6% |
| Croatians | 0.1 /100 | #280 | Tragic 9.6% |
| Bangladeshis | 0.1 /100 | #281 | Tragic 9.6% |
| Macedonians | 0.0 /100 | #282 | Tragic 9.6% |
| Immigrants | Nigeria | 0.0 /100 | #283 | Tragic 9.6% |
| Europeans | 0.0 /100 | #284 | Tragic 9.7% |
| Carpatho Rusyns | 0.0 /100 | #285 | Tragic 9.7% |
| Nigerians | 0.0 /100 | #286 | Tragic 9.7% |
| Danes | 0.0 /100 | #287 | Tragic 9.7% |
| Canadians | 0.0 /100 | #288 | Tragic 9.7% |
| Czechs | 0.0 /100 | #289 | Tragic 9.7% |
| Sioux | 0.0 /100 | #290 | Tragic 9.7% |
| Scandinavians | 0.0 /100 | #291 | Tragic 9.7% |
| Immigrants | Western Africa | 0.0 /100 | #292 | Tragic 9.8% |
Demographics Similar to Bermudans by Unemployment Among Seniors over 75 years
In terms of unemployment among seniors over 75 years, the demographic groups most similar to Bermudans are Salvadoran (8.9%, a difference of 0.040%), Delaware (9.0%, a difference of 0.050%), Immigrants from Philippines (8.9%, a difference of 0.080%), Malaysian (8.9%, a difference of 0.13%), and Romanian (9.0%, a difference of 0.13%).
| Demographics | Rating | Rank | Unemployment Among Seniors over 75 years |
| Immigrants | Northern Europe | 23.9 /100 | #203 | Fair 8.9% |
| Spaniards | 22.0 /100 | #204 | Fair 8.9% |
| Koreans | 21.9 /100 | #205 | Fair 8.9% |
| Immigrants | Western Europe | 18.2 /100 | #206 | Poor 8.9% |
| Malaysians | 16.3 /100 | #207 | Poor 8.9% |
| Immigrants | Philippines | 15.8 /100 | #208 | Poor 8.9% |
| Salvadorans | 15.4 /100 | #209 | Poor 8.9% |
| Bermudans | 15.0 /100 | #210 | Poor 8.9% |
| Delaware | 14.6 /100 | #211 | Poor 9.0% |
| Romanians | 13.8 /100 | #212 | Poor 9.0% |
| Immigrants | Latin America | 13.4 /100 | #213 | Poor 9.0% |
| Immigrants | Brazil | 13.3 /100 | #214 | Poor 9.0% |
| Immigrants | Western Asia | 12.5 /100 | #215 | Poor 9.0% |
| Immigrants | Oceania | 11.8 /100 | #216 | Poor 9.0% |
| Lebanese | 11.1 /100 | #217 | Poor 9.0% |