Immigrants from Congo vs Immigrants from Uruguay Male Unemployment
COMPARE
Immigrants from Congo
Immigrants from Uruguay
Male Unemployment
Male Unemployment Comparison
Immigrants from Congo
Immigrants from Uruguay
5.3%
MALE UNEMPLOYMENT
57.4/ 100
METRIC RATING
169th/ 347
METRIC RANK
5.2%
MALE UNEMPLOYMENT
73.9/ 100
METRIC RATING
153rd/ 347
METRIC RANK
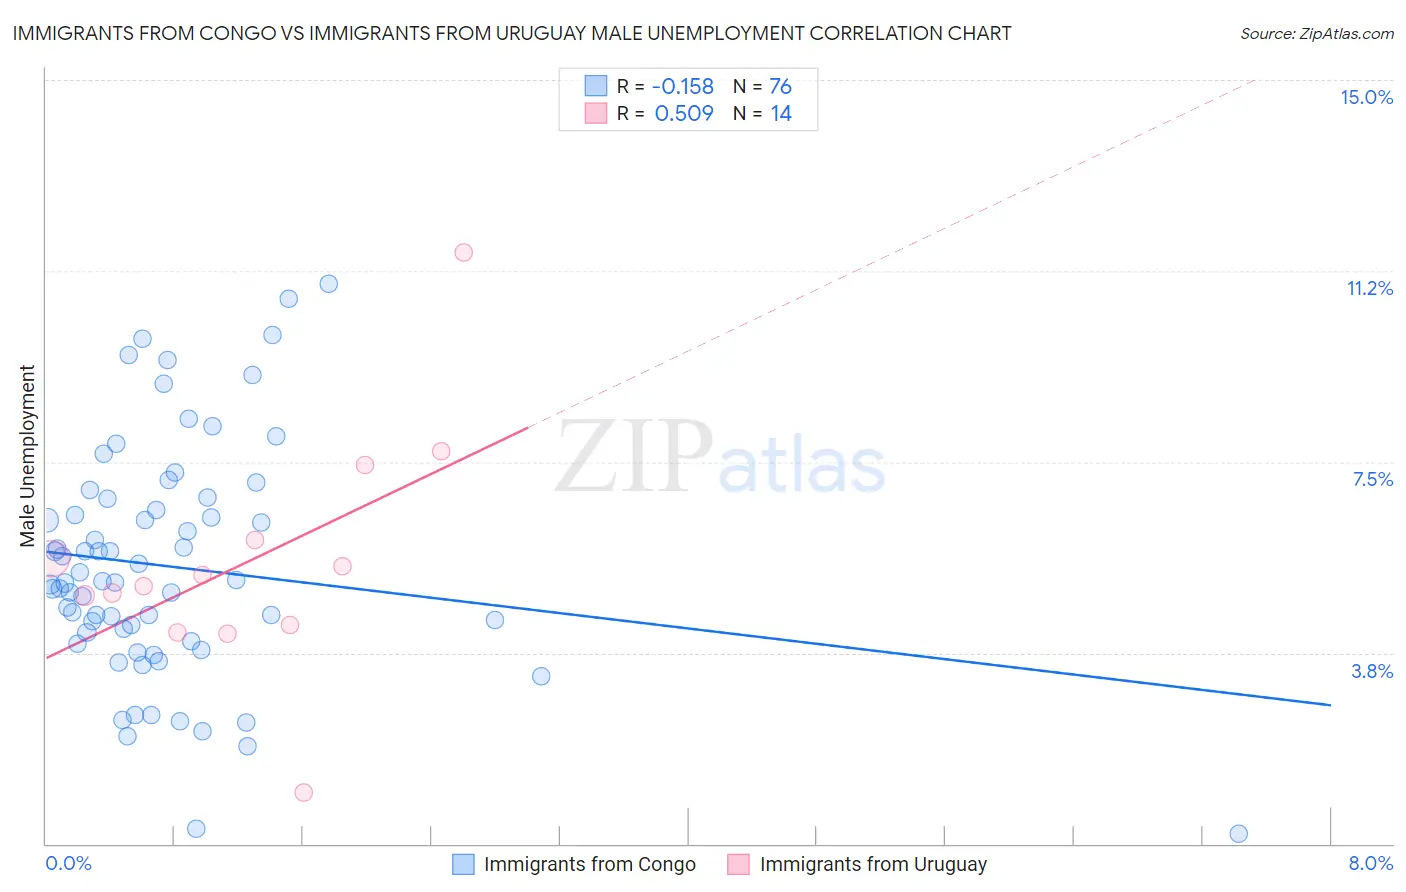
Immigrants from Congo vs Immigrants from Uruguay Male Unemployment Correlation Chart
The statistical analysis conducted on geographies consisting of 92,075,250 people shows a poor negative correlation between the proportion of Immigrants from Congo and unemployment rate among males in the United States with a correlation coefficient (R) of -0.158 and weighted average of 5.3%. Similarly, the statistical analysis conducted on geographies consisting of 133,186,426 people shows a substantial positive correlation between the proportion of Immigrants from Uruguay and unemployment rate among males in the United States with a correlation coefficient (R) of 0.509 and weighted average of 5.2%, a difference of 1.1%.
Male Unemployment Correlation Summary
| Measurement | Immigrants from Congo | Immigrants from Uruguay |
| Minimum | 0.20% | 1.0% |
| Maximum | 11.0% | 11.6% |
| Range | 10.8% | 10.6% |
| Mean | 5.4% | 5.5% |
| Median | 5.1% | 5.2% |
| Interquartile 25% (IQ1) | 4.1% | 4.3% |
| Interquartile 75% (IQ3) | 6.7% | 6.0% |
| Interquartile Range (IQR) | 2.6% | 1.7% |
| Standard Deviation (Sample) | 2.3% | 2.4% |
| Standard Deviation (Population) | 2.3% | 2.3% |
Demographics Similar to Immigrants from Congo and Immigrants from Uruguay by Male Unemployment
In terms of male unemployment, the demographic groups most similar to Immigrants from Congo are Immigrants from Ireland (5.3%, a difference of 0.020%), Immigrants from Vietnam (5.3%, a difference of 0.040%), Immigrants from Morocco (5.3%, a difference of 0.17%), South American (5.3%, a difference of 0.20%), and Immigrants from Eastern Europe (5.3%, a difference of 0.20%). Similarly, the demographic groups most similar to Immigrants from Uruguay are Laotian (5.2%, a difference of 0.010%), Immigrants from Hungary (5.2%, a difference of 0.040%), Egyptian (5.2%, a difference of 0.070%), American (5.2%, a difference of 0.090%), and Immigrants from Northern Africa (5.2%, a difference of 0.12%).
| Demographics | Rating | Rank | Male Unemployment |
| Slovaks | 75.5 /100 | #151 | Good 5.2% |
| Egyptians | 74.8 /100 | #152 | Good 5.2% |
| Immigrants | Uruguay | 73.9 /100 | #153 | Good 5.2% |
| Laotians | 73.8 /100 | #154 | Good 5.2% |
| Immigrants | Hungary | 73.4 /100 | #155 | Good 5.2% |
| Americans | 72.7 /100 | #156 | Good 5.2% |
| Immigrants | Northern Africa | 72.3 /100 | #157 | Good 5.2% |
| Immigrants | Indonesia | 71.5 /100 | #158 | Good 5.2% |
| Indonesians | 71.2 /100 | #159 | Good 5.2% |
| Immigrants | Norway | 71.0 /100 | #160 | Good 5.2% |
| Immigrants | China | 70.6 /100 | #161 | Good 5.2% |
| Immigrants | Egypt | 65.9 /100 | #162 | Good 5.2% |
| Immigrants | Hong Kong | 65.7 /100 | #163 | Good 5.2% |
| Afghans | 62.0 /100 | #164 | Good 5.3% |
| South Americans | 60.6 /100 | #165 | Good 5.3% |
| Immigrants | Morocco | 60.2 /100 | #166 | Good 5.3% |
| Immigrants | Vietnam | 58.1 /100 | #167 | Average 5.3% |
| Immigrants | Ireland | 57.7 /100 | #168 | Average 5.3% |
| Immigrants | Congo | 57.4 /100 | #169 | Average 5.3% |
| Immigrants | Eastern Europe | 54.1 /100 | #170 | Average 5.3% |
| Peruvians | 51.9 /100 | #171 | Average 5.3% |