American vs Immigrants from Panama Male Unemployment
COMPARE
American
Immigrants from Panama
Male Unemployment
Male Unemployment Comparison
Americans
Immigrants from Panama
5.2%
MALE UNEMPLOYMENT
72.7/ 100
METRIC RATING
156th/ 347
METRIC RANK
5.6%
MALE UNEMPLOYMENT
1.8/ 100
METRIC RATING
227th/ 347
METRIC RANK
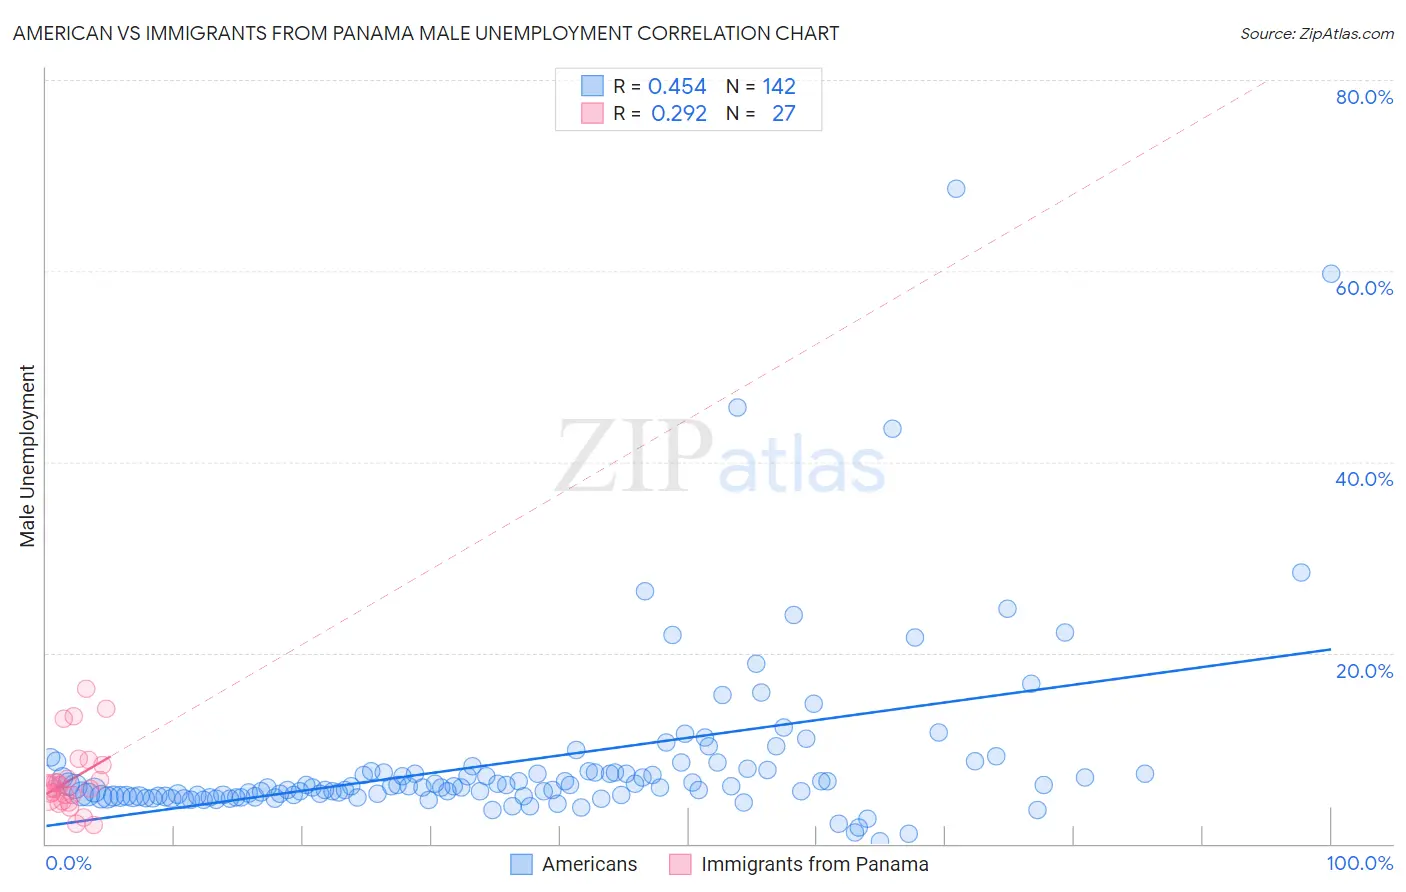
American vs Immigrants from Panama Male Unemployment Correlation Chart
The statistical analysis conducted on geographies consisting of 568,902,342 people shows a moderate positive correlation between the proportion of Americans and unemployment rate among males in the United States with a correlation coefficient (R) of 0.454 and weighted average of 5.2%. Similarly, the statistical analysis conducted on geographies consisting of 220,860,103 people shows a weak positive correlation between the proportion of Immigrants from Panama and unemployment rate among males in the United States with a correlation coefficient (R) of 0.292 and weighted average of 5.6%, a difference of 7.4%.
Male Unemployment Correlation Summary
| Measurement | American | Immigrants from Panama |
| Minimum | 0.30% | 1.9% |
| Maximum | 68.6% | 16.2% |
| Range | 68.3% | 14.3% |
| Mean | 8.7% | 6.8% |
| Median | 6.0% | 5.8% |
| Interquartile 25% (IQ1) | 5.0% | 4.4% |
| Interquartile 75% (IQ3) | 7.6% | 8.3% |
| Interquartile Range (IQR) | 2.6% | 3.9% |
| Standard Deviation (Sample) | 9.3% | 3.6% |
| Standard Deviation (Population) | 9.3% | 3.6% |
Similar Demographics by Male Unemployment
Demographics Similar to Americans by Male Unemployment
In terms of male unemployment, the demographic groups most similar to Americans are Immigrants from Northern Africa (5.2%, a difference of 0.030%), Immigrants from Hungary (5.2%, a difference of 0.060%), Immigrants from Indonesia (5.2%, a difference of 0.080%), Immigrants from Uruguay (5.2%, a difference of 0.090%), and Laotian (5.2%, a difference of 0.090%).
| Demographics | Rating | Rank | Male Unemployment |
| Immigrants | Europe | 76.2 /100 | #149 | Good 5.2% |
| Indians (Asian) | 76.0 /100 | #150 | Good 5.2% |
| Slovaks | 75.5 /100 | #151 | Good 5.2% |
| Egyptians | 74.8 /100 | #152 | Good 5.2% |
| Immigrants | Uruguay | 73.9 /100 | #153 | Good 5.2% |
| Laotians | 73.8 /100 | #154 | Good 5.2% |
| Immigrants | Hungary | 73.4 /100 | #155 | Good 5.2% |
| Americans | 72.7 /100 | #156 | Good 5.2% |
| Immigrants | Northern Africa | 72.3 /100 | #157 | Good 5.2% |
| Immigrants | Indonesia | 71.5 /100 | #158 | Good 5.2% |
| Indonesians | 71.2 /100 | #159 | Good 5.2% |
| Immigrants | Norway | 71.0 /100 | #160 | Good 5.2% |
| Immigrants | China | 70.6 /100 | #161 | Good 5.2% |
| Immigrants | Egypt | 65.9 /100 | #162 | Good 5.2% |
| Immigrants | Hong Kong | 65.7 /100 | #163 | Good 5.2% |
Demographics Similar to Immigrants from Panama by Male Unemployment
In terms of male unemployment, the demographic groups most similar to Immigrants from Panama are Immigrants from Cambodia (5.6%, a difference of 0.0%), Seminole (5.6%, a difference of 0.020%), Central American (5.6%, a difference of 0.020%), Immigrants from Africa (5.6%, a difference of 0.060%), and Panamanian (5.6%, a difference of 0.090%).
| Demographics | Rating | Rank | Male Unemployment |
| Portuguese | 3.5 /100 | #220 | Tragic 5.6% |
| Soviet Union | 3.2 /100 | #221 | Tragic 5.6% |
| Immigrants | Micronesia | 2.9 /100 | #222 | Tragic 5.6% |
| Creek | 2.6 /100 | #223 | Tragic 5.6% |
| Cherokee | 2.4 /100 | #224 | Tragic 5.6% |
| Panamanians | 1.9 /100 | #225 | Tragic 5.6% |
| Immigrants | Cambodia | 1.8 /100 | #226 | Tragic 5.6% |
| Immigrants | Panama | 1.8 /100 | #227 | Tragic 5.6% |
| Seminole | 1.8 /100 | #228 | Tragic 5.6% |
| Central Americans | 1.8 /100 | #229 | Tragic 5.6% |
| Immigrants | Africa | 1.7 /100 | #230 | Tragic 5.6% |
| Choctaw | 1.6 /100 | #231 | Tragic 5.6% |
| Moroccans | 1.6 /100 | #232 | Tragic 5.6% |
| Somalis | 1.5 /100 | #233 | Tragic 5.6% |
| Immigrants | Somalia | 1.5 /100 | #234 | Tragic 5.6% |