Immigrants from Austria vs Finnish Unemployment
COMPARE
Immigrants from Austria
Finnish
Unemployment
Unemployment Comparison
Immigrants from Austria
Finns
5.0%
UNEMPLOYMENT
95.9/ 100
METRIC RATING
94th/ 347
METRIC RANK
4.7%
UNEMPLOYMENT
99.9/ 100
METRIC RATING
27th/ 347
METRIC RANK
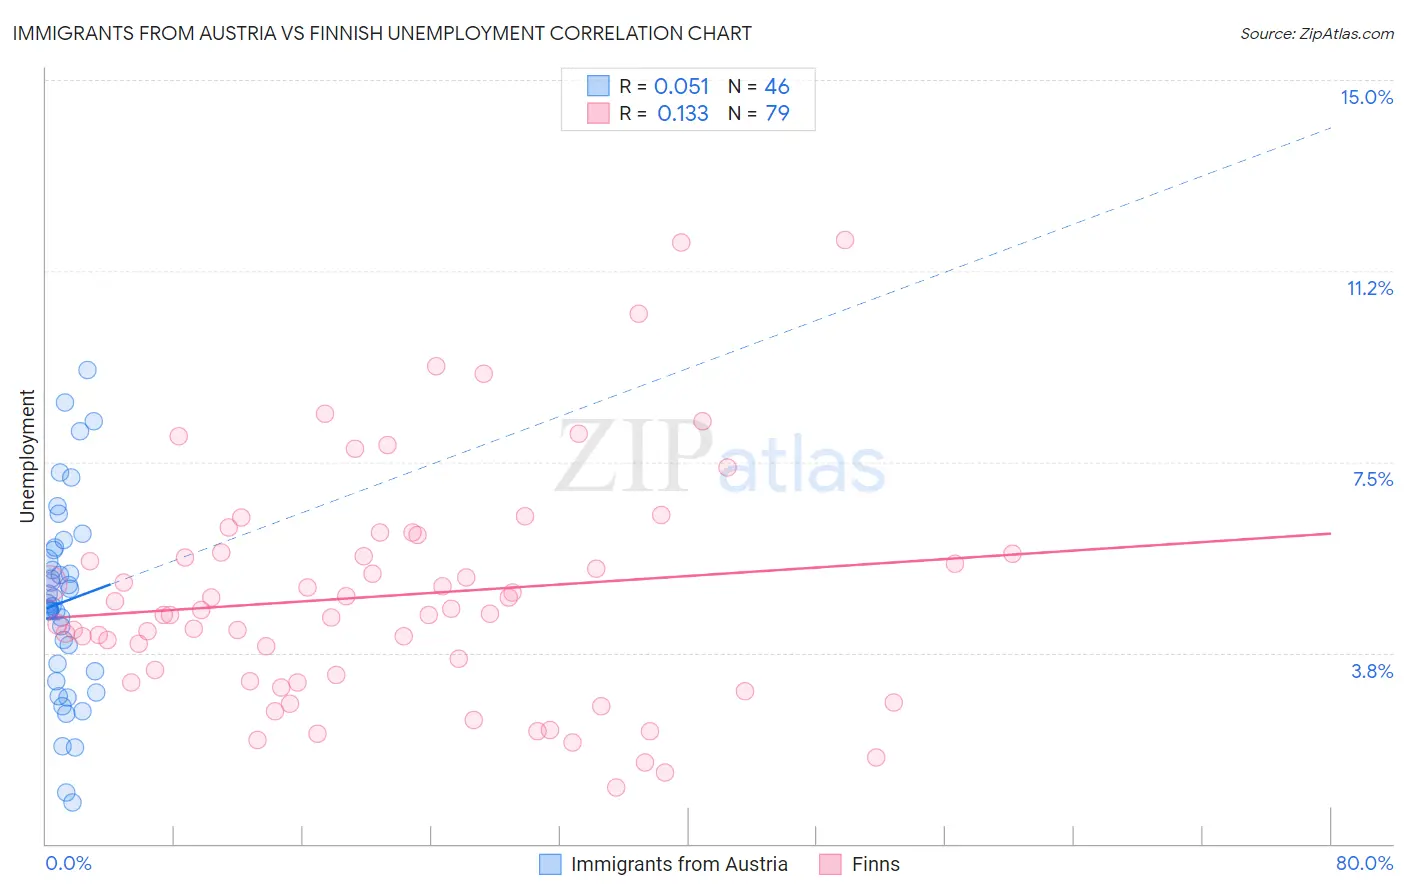
Immigrants from Austria vs Finnish Unemployment Correlation Chart
The statistical analysis conducted on geographies consisting of 167,916,125 people shows a slight positive correlation between the proportion of Immigrants from Austria and unemployment in the United States with a correlation coefficient (R) of 0.051 and weighted average of 5.0%. Similarly, the statistical analysis conducted on geographies consisting of 403,879,185 people shows a poor positive correlation between the proportion of Finns and unemployment in the United States with a correlation coefficient (R) of 0.133 and weighted average of 4.7%, a difference of 5.9%.
Unemployment Correlation Summary
| Measurement | Immigrants from Austria | Finnish |
| Minimum | 0.82% | 1.1% |
| Maximum | 9.3% | 11.9% |
| Range | 8.5% | 10.8% |
| Mean | 4.8% | 4.9% |
| Median | 4.7% | 4.5% |
| Interquartile 25% (IQ1) | 3.4% | 3.2% |
| Interquartile 75% (IQ3) | 5.8% | 5.7% |
| Interquartile Range (IQR) | 2.4% | 2.5% |
| Standard Deviation (Sample) | 1.9% | 2.3% |
| Standard Deviation (Population) | 1.9% | 2.2% |
Similar Demographics by Unemployment
Demographics Similar to Immigrants from Austria by Unemployment
In terms of unemployment, the demographic groups most similar to Immigrants from Austria are Ukrainian (5.0%, a difference of 0.030%), Immigrants from South Africa (5.0%, a difference of 0.12%), Immigrants from Serbia (5.0%, a difference of 0.13%), Immigrants from Sudan (5.0%, a difference of 0.14%), and Immigrants from North Macedonia (5.0%, a difference of 0.16%).
| Demographics | Rating | Rank | Unemployment |
| Immigrants | Moldova | 96.6 /100 | #87 | Exceptional 5.0% |
| Immigrants | Korea | 96.6 /100 | #88 | Exceptional 5.0% |
| Jordanians | 96.4 /100 | #89 | Exceptional 5.0% |
| Immigrants | North Macedonia | 96.3 /100 | #90 | Exceptional 5.0% |
| Immigrants | Sudan | 96.3 /100 | #91 | Exceptional 5.0% |
| Immigrants | South Africa | 96.2 /100 | #92 | Exceptional 5.0% |
| Ukrainians | 96.0 /100 | #93 | Exceptional 5.0% |
| Immigrants | Austria | 95.9 /100 | #94 | Exceptional 5.0% |
| Immigrants | Serbia | 95.6 /100 | #95 | Exceptional 5.0% |
| Immigrants | England | 95.2 /100 | #96 | Exceptional 5.0% |
| Immigrants | Czechoslovakia | 95.1 /100 | #97 | Exceptional 5.0% |
| Romanians | 95.0 /100 | #98 | Exceptional 5.0% |
| Mongolians | 94.8 /100 | #99 | Exceptional 5.0% |
| Estonians | 94.6 /100 | #100 | Exceptional 5.0% |
| Americans | 94.3 /100 | #101 | Exceptional 5.0% |
Demographics Similar to Finns by Unemployment
In terms of unemployment, the demographic groups most similar to Finns are Bulgarian (4.7%, a difference of 0.21%), Latvian (4.7%, a difference of 0.25%), Venezuelan (4.7%, a difference of 0.32%), Cuban (4.7%, a difference of 0.32%), and British (4.7%, a difference of 0.40%).
| Demographics | Rating | Rank | Unemployment |
| Carpatho Rusyns | 99.9 /100 | #20 | Exceptional 4.7% |
| Welsh | 99.9 /100 | #21 | Exceptional 4.7% |
| Thais | 99.9 /100 | #22 | Exceptional 4.7% |
| British | 99.9 /100 | #23 | Exceptional 4.7% |
| Venezuelans | 99.9 /100 | #24 | Exceptional 4.7% |
| Latvians | 99.9 /100 | #25 | Exceptional 4.7% |
| Bulgarians | 99.9 /100 | #26 | Exceptional 4.7% |
| Finns | 99.9 /100 | #27 | Exceptional 4.7% |
| Cubans | 99.8 /100 | #28 | Exceptional 4.7% |
| Poles | 99.8 /100 | #29 | Exceptional 4.7% |
| Irish | 99.8 /100 | #30 | Exceptional 4.8% |
| Croatians | 99.8 /100 | #31 | Exceptional 4.8% |
| Zimbabweans | 99.8 /100 | #32 | Exceptional 4.8% |
| Sudanese | 99.8 /100 | #33 | Exceptional 4.8% |
| Immigrants | Bolivia | 99.8 /100 | #34 | Exceptional 4.8% |