Eastern European vs Immigrants from Eastern Asia Unemployment Among Ages 60 to 64 years
COMPARE
Eastern European
Immigrants from Eastern Asia
Unemployment Among Ages 60 to 64 years
Unemployment Among Ages 60 to 64 years Comparison
Eastern Europeans
Immigrants from Eastern Asia
4.9%
UNEMPLOYMENT AMONG AGES 60 TO 64 YEARS
14.3/ 100
METRIC RATING
213th/ 347
METRIC RANK
5.0%
UNEMPLOYMENT AMONG AGES 60 TO 64 YEARS
4.7/ 100
METRIC RATING
232nd/ 347
METRIC RANK
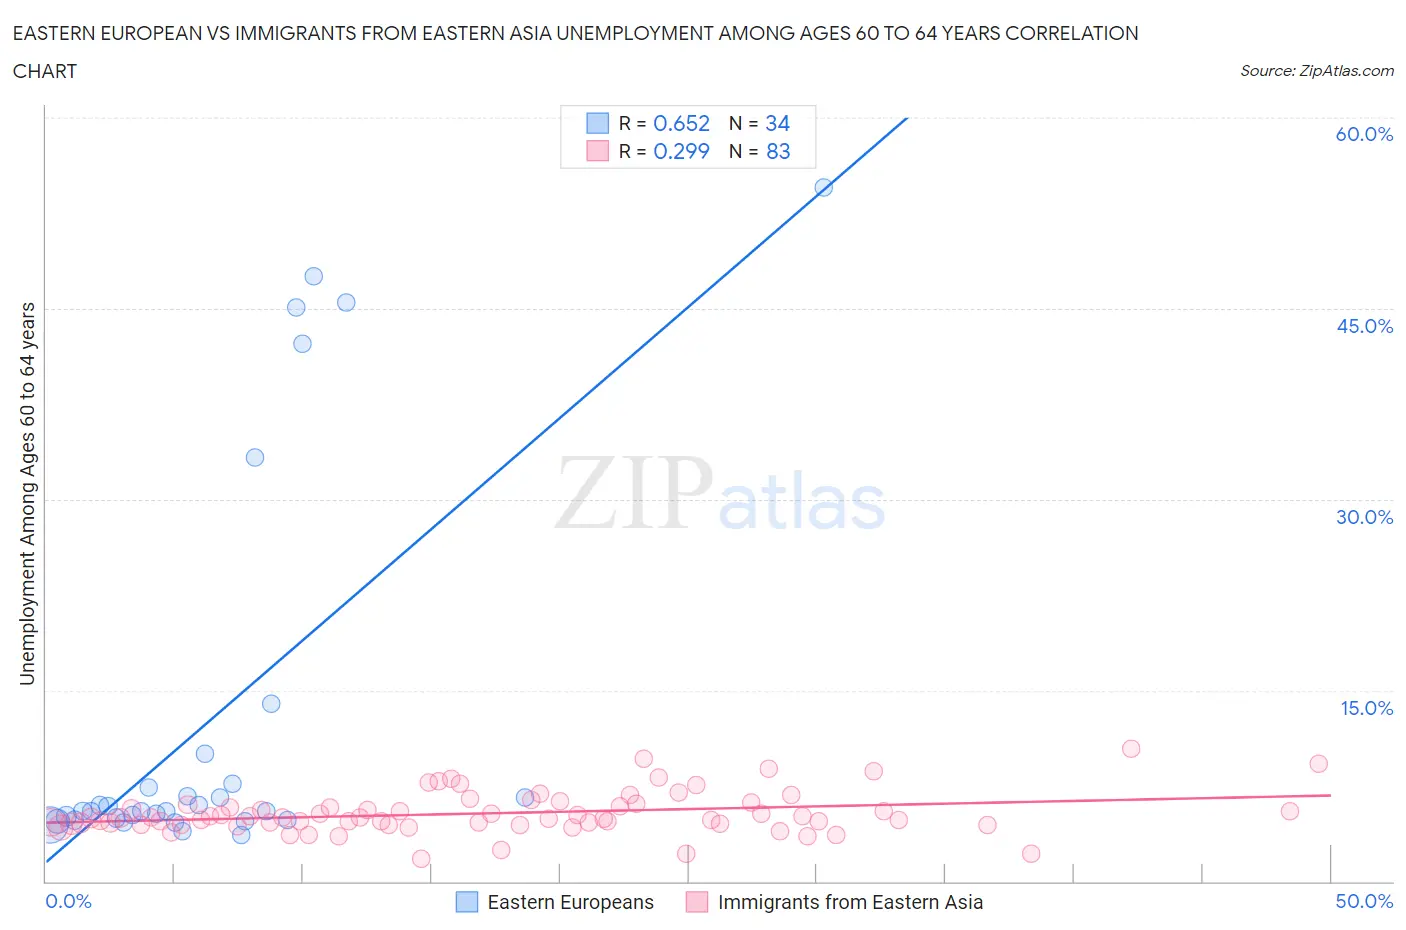
Eastern European vs Immigrants from Eastern Asia Unemployment Among Ages 60 to 64 years Correlation Chart
The statistical analysis conducted on geographies consisting of 402,479,277 people shows a significant positive correlation between the proportion of Eastern Europeans and unemployment rate among population between the ages 60 and 64 in the United States with a correlation coefficient (R) of 0.652 and weighted average of 4.9%. Similarly, the statistical analysis conducted on geographies consisting of 434,190,797 people shows a weak positive correlation between the proportion of Immigrants from Eastern Asia and unemployment rate among population between the ages 60 and 64 in the United States with a correlation coefficient (R) of 0.299 and weighted average of 5.0%, a difference of 1.1%.
Unemployment Among Ages 60 to 64 years Correlation Summary
| Measurement | Eastern European | Immigrants from Eastern Asia |
| Minimum | 3.6% | 1.8% |
| Maximum | 54.5% | 10.4% |
| Range | 50.9% | 8.6% |
| Mean | 12.7% | 5.3% |
| Median | 5.5% | 5.0% |
| Interquartile 25% (IQ1) | 4.8% | 4.5% |
| Interquartile 75% (IQ3) | 7.6% | 6.0% |
| Interquartile Range (IQR) | 2.8% | 1.5% |
| Standard Deviation (Sample) | 15.4% | 1.6% |
| Standard Deviation (Population) | 15.1% | 1.6% |
Demographics Similar to Eastern Europeans and Immigrants from Eastern Asia by Unemployment Among Ages 60 to 64 years
In terms of unemployment among ages 60 to 64 years, the demographic groups most similar to Eastern Europeans are Immigrants from Russia (4.9%, a difference of 0.040%), Moroccan (4.9%, a difference of 0.050%), Immigrants from South Eastern Asia (4.9%, a difference of 0.090%), Cajun (4.9%, a difference of 0.15%), and Korean (4.9%, a difference of 0.16%). Similarly, the demographic groups most similar to Immigrants from Eastern Asia are Immigrants from Denmark (5.0%, a difference of 0.18%), Tohono O'odham (5.0%, a difference of 0.18%), African (5.0%, a difference of 0.20%), Immigrants from Belarus (5.0%, a difference of 0.28%), and Immigrants from Chile (5.0%, a difference of 0.33%).
| Demographics | Rating | Rank | Unemployment Among Ages 60 to 64 years |
| Moroccans | 15.0 /100 | #212 | Poor 4.9% |
| Eastern Europeans | 14.3 /100 | #213 | Poor 4.9% |
| Immigrants | Russia | 13.7 /100 | #214 | Poor 4.9% |
| Immigrants | South Eastern Asia | 13.1 /100 | #215 | Poor 4.9% |
| Cajuns | 12.3 /100 | #216 | Poor 4.9% |
| Koreans | 12.2 /100 | #217 | Poor 4.9% |
| Immigrants | Singapore | 12.0 /100 | #218 | Poor 4.9% |
| Immigrants | Brazil | 11.7 /100 | #219 | Poor 4.9% |
| Ottawa | 11.6 /100 | #220 | Poor 4.9% |
| Ugandans | 10.5 /100 | #221 | Poor 4.9% |
| Brazilians | 10.1 /100 | #222 | Poor 5.0% |
| Crow | 9.7 /100 | #223 | Tragic 5.0% |
| Immigrants | Cameroon | 8.5 /100 | #224 | Tragic 5.0% |
| Immigrants | Ireland | 7.2 /100 | #225 | Tragic 5.0% |
| Immigrants | Chile | 6.8 /100 | #226 | Tragic 5.0% |
| Nigerians | 6.8 /100 | #227 | Tragic 5.0% |
| Immigrants | Belarus | 6.4 /100 | #228 | Tragic 5.0% |
| Africans | 5.9 /100 | #229 | Tragic 5.0% |
| Immigrants | Denmark | 5.8 /100 | #230 | Tragic 5.0% |
| Tohono O'odham | 5.7 /100 | #231 | Tragic 5.0% |
| Immigrants | Eastern Asia | 4.7 /100 | #232 | Tragic 5.0% |