Eastern European vs Immigrants from Costa Rica Unemployment Among Ages 60 to 64 years
COMPARE
Eastern European
Immigrants from Costa Rica
Unemployment Among Ages 60 to 64 years
Unemployment Among Ages 60 to 64 years Comparison
Eastern Europeans
Immigrants from Costa Rica
4.9%
UNEMPLOYMENT AMONG AGES 60 TO 64 YEARS
14.3/ 100
METRIC RATING
213th/ 347
METRIC RANK
5.1%
UNEMPLOYMENT AMONG AGES 60 TO 64 YEARS
0.2/ 100
METRIC RATING
269th/ 347
METRIC RANK
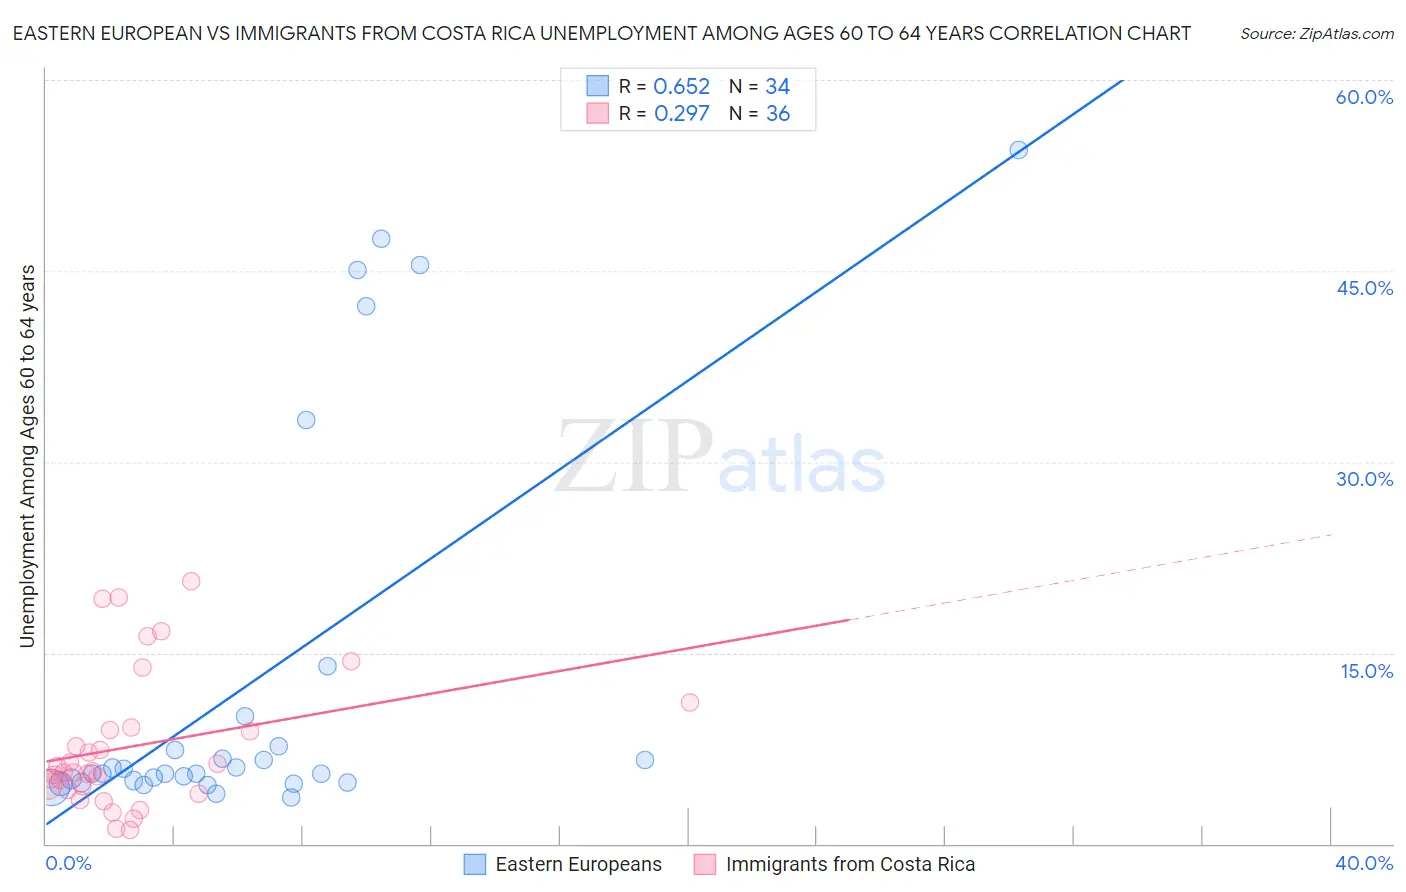
Eastern European vs Immigrants from Costa Rica Unemployment Among Ages 60 to 64 years Correlation Chart
The statistical analysis conducted on geographies consisting of 402,479,277 people shows a significant positive correlation between the proportion of Eastern Europeans and unemployment rate among population between the ages 60 and 64 in the United States with a correlation coefficient (R) of 0.652 and weighted average of 4.9%. Similarly, the statistical analysis conducted on geographies consisting of 195,089,274 people shows a weak positive correlation between the proportion of Immigrants from Costa Rica and unemployment rate among population between the ages 60 and 64 in the United States with a correlation coefficient (R) of 0.297 and weighted average of 5.1%, a difference of 4.0%.
Unemployment Among Ages 60 to 64 years Correlation Summary
| Measurement | Eastern European | Immigrants from Costa Rica |
| Minimum | 3.6% | 1.1% |
| Maximum | 54.5% | 20.6% |
| Range | 50.9% | 19.5% |
| Mean | 12.7% | 7.7% |
| Median | 5.5% | 5.7% |
| Interquartile 25% (IQ1) | 4.8% | 4.4% |
| Interquartile 75% (IQ3) | 7.6% | 9.0% |
| Interquartile Range (IQR) | 2.8% | 4.6% |
| Standard Deviation (Sample) | 15.4% | 5.3% |
| Standard Deviation (Population) | 15.1% | 5.2% |
Similar Demographics by Unemployment Among Ages 60 to 64 years
Demographics Similar to Eastern Europeans by Unemployment Among Ages 60 to 64 years
In terms of unemployment among ages 60 to 64 years, the demographic groups most similar to Eastern Europeans are Immigrants from Russia (4.9%, a difference of 0.040%), Moroccan (4.9%, a difference of 0.050%), Blackfeet (4.9%, a difference of 0.090%), Immigrants from South Eastern Asia (4.9%, a difference of 0.090%), and Cherokee (4.9%, a difference of 0.12%).
| Demographics | Rating | Rank | Unemployment Among Ages 60 to 64 years |
| New Zealanders | 17.4 /100 | #206 | Poor 4.9% |
| Chippewa | 17.3 /100 | #207 | Poor 4.9% |
| German Russians | 16.8 /100 | #208 | Poor 4.9% |
| Sierra Leoneans | 16.5 /100 | #209 | Poor 4.9% |
| Cherokee | 16.1 /100 | #210 | Poor 4.9% |
| Blackfeet | 15.7 /100 | #211 | Poor 4.9% |
| Moroccans | 15.0 /100 | #212 | Poor 4.9% |
| Eastern Europeans | 14.3 /100 | #213 | Poor 4.9% |
| Immigrants | Russia | 13.7 /100 | #214 | Poor 4.9% |
| Immigrants | South Eastern Asia | 13.1 /100 | #215 | Poor 4.9% |
| Cajuns | 12.3 /100 | #216 | Poor 4.9% |
| Koreans | 12.2 /100 | #217 | Poor 4.9% |
| Immigrants | Singapore | 12.0 /100 | #218 | Poor 4.9% |
| Immigrants | Brazil | 11.7 /100 | #219 | Poor 4.9% |
| Ottawa | 11.6 /100 | #220 | Poor 4.9% |
Demographics Similar to Immigrants from Costa Rica by Unemployment Among Ages 60 to 64 years
In terms of unemployment among ages 60 to 64 years, the demographic groups most similar to Immigrants from Costa Rica are Central American Indian (5.1%, a difference of 0.040%), Immigrants from Bahamas (5.1%, a difference of 0.20%), Immigrants from Australia (5.1%, a difference of 0.25%), Immigrants from Argentina (5.1%, a difference of 0.27%), and Immigrants from Iran (5.1%, a difference of 0.31%).
| Demographics | Rating | Rank | Unemployment Among Ages 60 to 64 years |
| Immigrants | Uzbekistan | 0.4 /100 | #262 | Tragic 5.1% |
| Immigrants | Immigrants | 0.4 /100 | #263 | Tragic 5.1% |
| Sioux | 0.3 /100 | #264 | Tragic 5.1% |
| Immigrants | Argentina | 0.2 /100 | #265 | Tragic 5.1% |
| Immigrants | Australia | 0.2 /100 | #266 | Tragic 5.1% |
| Immigrants | Bahamas | 0.2 /100 | #267 | Tragic 5.1% |
| Central American Indians | 0.2 /100 | #268 | Tragic 5.1% |
| Immigrants | Costa Rica | 0.2 /100 | #269 | Tragic 5.1% |
| Immigrants | Iran | 0.1 /100 | #270 | Tragic 5.1% |
| Israelis | 0.1 /100 | #271 | Tragic 5.2% |
| Haitians | 0.1 /100 | #272 | Tragic 5.2% |
| Immigrants | Spain | 0.1 /100 | #273 | Tragic 5.2% |
| Hopi | 0.1 /100 | #274 | Tragic 5.2% |
| Immigrants | Hong Kong | 0.1 /100 | #275 | Tragic 5.2% |
| Central Americans | 0.0 /100 | #276 | Tragic 5.2% |