Eastern European vs Burmese Unemployment Among Women with Children Under 6 years
COMPARE
Eastern European
Burmese
Unemployment Among Women with Children Under 6 years
Unemployment Among Women with Children Under 6 years Comparison
Eastern Europeans
Burmese
7.2%
UNEMPLOYMENT AMONG WOMEN WITH CHILDREN UNDER 6 YEARS
96.9/ 100
METRIC RATING
108th/ 347
METRIC RANK
6.5%
UNEMPLOYMENT AMONG WOMEN WITH CHILDREN UNDER 6 YEARS
100.0/ 100
METRIC RATING
21st/ 347
METRIC RANK
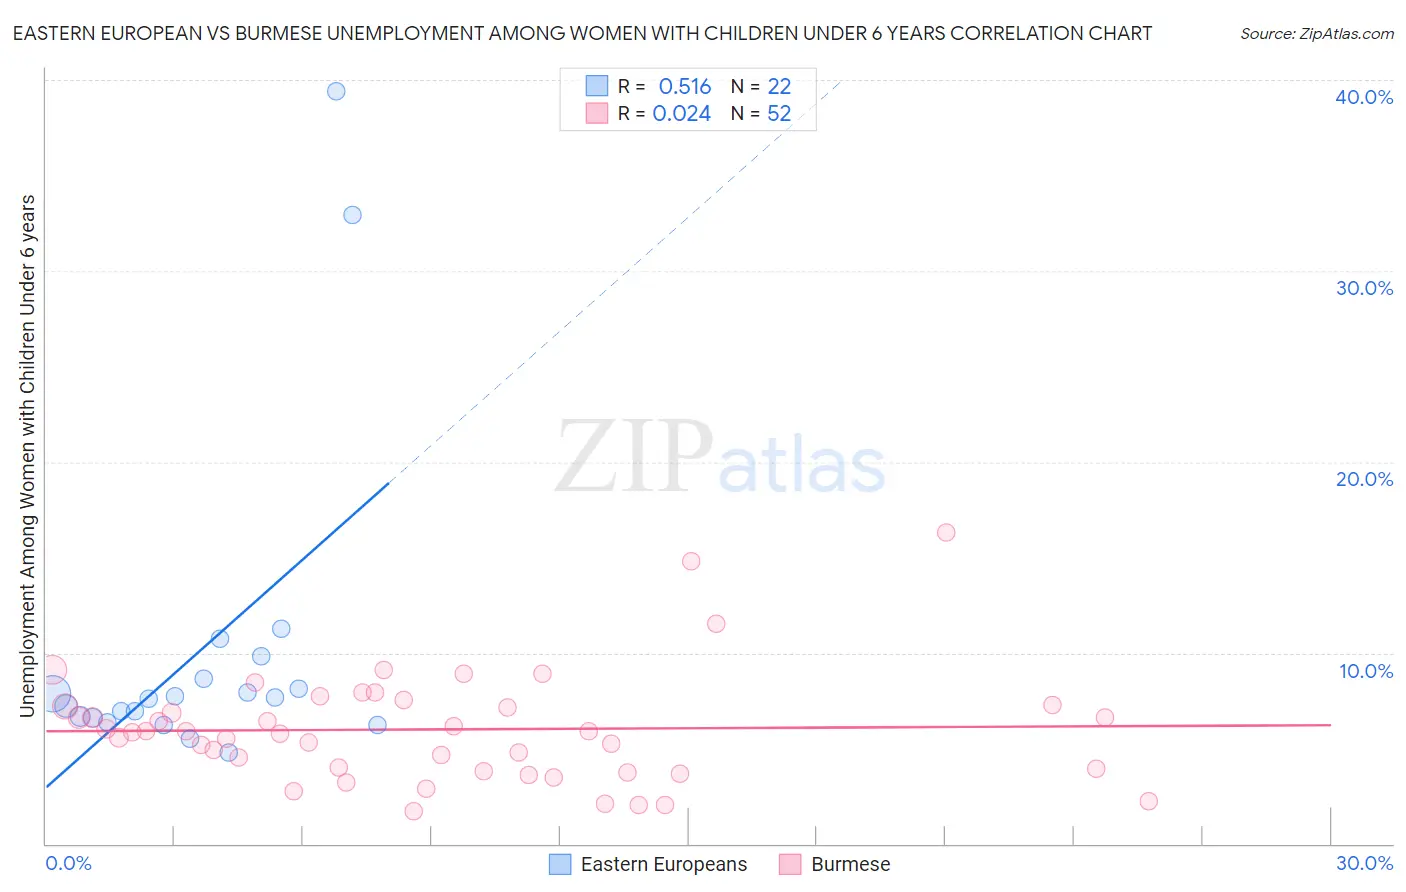
Eastern European vs Burmese Unemployment Among Women with Children Under 6 years Correlation Chart
The statistical analysis conducted on geographies consisting of 326,999,970 people shows a substantial positive correlation between the proportion of Eastern Europeans and unemployment rate among women with children under the age of 6 in the United States with a correlation coefficient (R) of 0.516 and weighted average of 7.2%. Similarly, the statistical analysis conducted on geographies consisting of 339,459,129 people shows no correlation between the proportion of Burmese and unemployment rate among women with children under the age of 6 in the United States with a correlation coefficient (R) of 0.024 and weighted average of 6.5%, a difference of 11.2%.
Unemployment Among Women with Children Under 6 years Correlation Summary
| Measurement | Eastern European | Burmese |
| Minimum | 4.8% | 1.7% |
| Maximum | 39.4% | 16.3% |
| Range | 34.6% | 14.6% |
| Mean | 10.1% | 6.0% |
| Median | 7.6% | 5.9% |
| Interquartile 25% (IQ1) | 6.6% | 3.8% |
| Interquartile 75% (IQ3) | 8.6% | 7.2% |
| Interquartile Range (IQR) | 2.0% | 3.4% |
| Standard Deviation (Sample) | 8.6% | 2.9% |
| Standard Deviation (Population) | 8.4% | 2.9% |
Similar Demographics by Unemployment Among Women with Children Under 6 years
Demographics Similar to Eastern Europeans by Unemployment Among Women with Children Under 6 years
In terms of unemployment among women with children under 6 years, the demographic groups most similar to Eastern Europeans are Australian (7.2%, a difference of 0.010%), Palestinian (7.2%, a difference of 0.080%), Immigrants from Kazakhstan (7.2%, a difference of 0.12%), Norwegian (7.2%, a difference of 0.13%), and Immigrants from Pakistan (7.2%, a difference of 0.14%).
| Demographics | Rating | Rank | Unemployment Among Women with Children Under 6 years |
| Chileans | 97.4 /100 | #101 | Exceptional 7.2% |
| Immigrants | Nicaragua | 97.3 /100 | #102 | Exceptional 7.2% |
| Immigrants | Saudi Arabia | 97.3 /100 | #103 | Exceptional 7.2% |
| Immigrants | Egypt | 97.2 /100 | #104 | Exceptional 7.2% |
| Venezuelans | 97.2 /100 | #105 | Exceptional 7.2% |
| Immigrants | Pakistan | 97.2 /100 | #106 | Exceptional 7.2% |
| Immigrants | Kazakhstan | 97.1 /100 | #107 | Exceptional 7.2% |
| Eastern Europeans | 96.9 /100 | #108 | Exceptional 7.2% |
| Australians | 96.9 /100 | #109 | Exceptional 7.2% |
| Palestinians | 96.8 /100 | #110 | Exceptional 7.2% |
| Norwegians | 96.7 /100 | #111 | Exceptional 7.2% |
| Israelis | 96.5 /100 | #112 | Exceptional 7.2% |
| Nicaraguans | 96.3 /100 | #113 | Exceptional 7.2% |
| Argentineans | 96.2 /100 | #114 | Exceptional 7.2% |
| Immigrants | Italy | 96.1 /100 | #115 | Exceptional 7.2% |
Demographics Similar to Burmese by Unemployment Among Women with Children Under 6 years
In terms of unemployment among women with children under 6 years, the demographic groups most similar to Burmese are Ute (6.5%, a difference of 0.050%), Mongolian (6.5%, a difference of 0.10%), Immigrants from Korea (6.5%, a difference of 0.42%), Assyrian/Chaldean/Syriac (6.5%, a difference of 0.43%), and Bulgarian (6.5%, a difference of 0.62%).
| Demographics | Rating | Rank | Unemployment Among Women with Children Under 6 years |
| Immigrants | Bulgaria | 100.0 /100 | #14 | Exceptional 6.3% |
| Thais | 100.0 /100 | #15 | Exceptional 6.3% |
| Immigrants | Uzbekistan | 100.0 /100 | #16 | Exceptional 6.3% |
| Immigrants | Malaysia | 100.0 /100 | #17 | Exceptional 6.4% |
| Assyrians/Chaldeans/Syriacs | 100.0 /100 | #18 | Exceptional 6.5% |
| Mongolians | 100.0 /100 | #19 | Exceptional 6.5% |
| Ute | 100.0 /100 | #20 | Exceptional 6.5% |
| Burmese | 100.0 /100 | #21 | Exceptional 6.5% |
| Immigrants | Korea | 100.0 /100 | #22 | Exceptional 6.5% |
| Bulgarians | 100.0 /100 | #23 | Exceptional 6.5% |
| Laotians | 100.0 /100 | #24 | Exceptional 6.5% |
| Soviet Union | 100.0 /100 | #25 | Exceptional 6.5% |
| Cypriots | 100.0 /100 | #26 | Exceptional 6.5% |
| Immigrants | Japan | 100.0 /100 | #27 | Exceptional 6.5% |
| Immigrants | Israel | 100.0 /100 | #28 | Exceptional 6.5% |