Eastern European vs Immigrants from Barbados Unemployment Among Youth under 25 years
COMPARE
Eastern European
Immigrants from Barbados
Unemployment Among Youth under 25 years
Unemployment Among Youth under 25 years Comparison
Eastern Europeans
Immigrants from Barbados
11.6%
UNEMPLOYMENT AMONG YOUTH UNDER 25 YEARS
57.5/ 100
METRIC RATING
169th/ 347
METRIC RANK
15.2%
UNEMPLOYMENT AMONG YOUTH UNDER 25 YEARS
0.0/ 100
METRIC RATING
326th/ 347
METRIC RANK
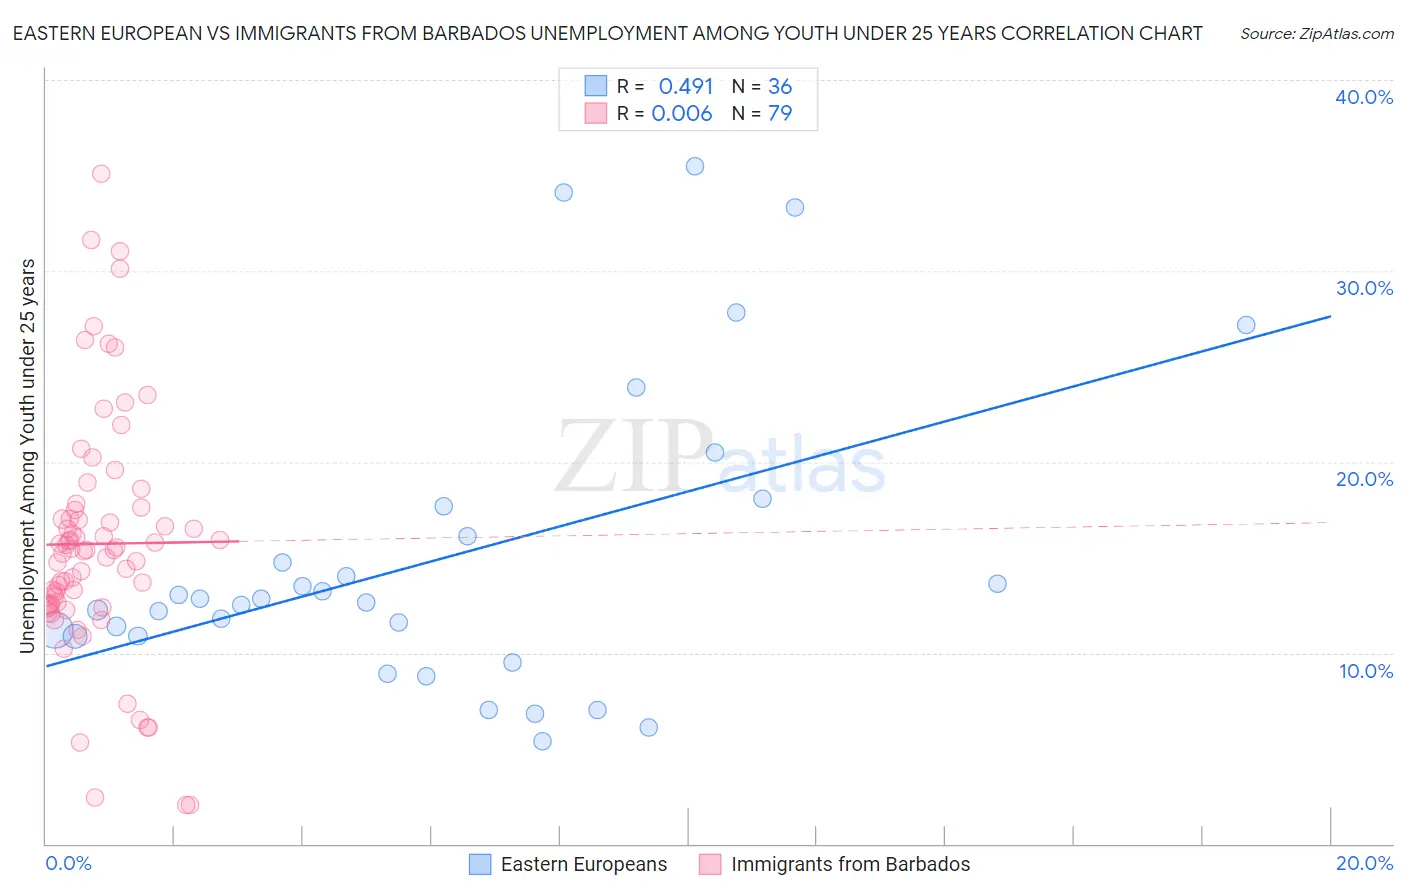
Eastern European vs Immigrants from Barbados Unemployment Among Youth under 25 years Correlation Chart
The statistical analysis conducted on geographies consisting of 451,295,495 people shows a moderate positive correlation between the proportion of Eastern Europeans and unemployment rate among youth under the age of 25 in the United States with a correlation coefficient (R) of 0.491 and weighted average of 11.6%. Similarly, the statistical analysis conducted on geographies consisting of 112,488,242 people shows no correlation between the proportion of Immigrants from Barbados and unemployment rate among youth under the age of 25 in the United States with a correlation coefficient (R) of 0.006 and weighted average of 15.2%, a difference of 31.7%.
Unemployment Among Youth under 25 years Correlation Summary
| Measurement | Eastern European | Immigrants from Barbados |
| Minimum | 5.3% | 2.0% |
| Maximum | 35.5% | 35.1% |
| Range | 30.2% | 33.1% |
| Mean | 15.0% | 15.7% |
| Median | 12.7% | 15.4% |
| Interquartile 25% (IQ1) | 10.9% | 12.5% |
| Interquartile 75% (IQ3) | 16.9% | 17.5% |
| Interquartile Range (IQR) | 6.0% | 5.0% |
| Standard Deviation (Sample) | 7.9% | 6.3% |
| Standard Deviation (Population) | 7.8% | 6.3% |
Similar Demographics by Unemployment Among Youth under 25 years
Demographics Similar to Eastern Europeans by Unemployment Among Youth under 25 years
In terms of unemployment among youth under 25 years, the demographic groups most similar to Eastern Europeans are Potawatomi (11.6%, a difference of 0.010%), Russian (11.6%, a difference of 0.010%), Okinawan (11.6%, a difference of 0.050%), Bangladeshi (11.6%, a difference of 0.080%), and Immigrants from Morocco (11.6%, a difference of 0.10%).
| Demographics | Rating | Rank | Unemployment Among Youth under 25 years |
| Immigrants | Northern Africa | 62.7 /100 | #162 | Good 11.5% |
| Immigrants | Kazakhstan | 62.7 /100 | #163 | Good 11.5% |
| Immigrants | Laos | 62.4 /100 | #164 | Good 11.5% |
| Immigrants | Sweden | 61.3 /100 | #165 | Good 11.5% |
| Spanish | 60.3 /100 | #166 | Good 11.6% |
| Okinawans | 58.7 /100 | #167 | Average 11.6% |
| Potawatomi | 57.9 /100 | #168 | Average 11.6% |
| Eastern Europeans | 57.5 /100 | #169 | Average 11.6% |
| Russians | 57.3 /100 | #170 | Average 11.6% |
| Bangladeshis | 55.6 /100 | #171 | Average 11.6% |
| Immigrants | Morocco | 55.1 /100 | #172 | Average 11.6% |
| Immigrants | South Eastern Asia | 51.7 /100 | #173 | Average 11.6% |
| Immigrants | China | 50.0 /100 | #174 | Average 11.6% |
| Immigrants | Iraq | 47.0 /100 | #175 | Average 11.6% |
| Ugandans | 45.6 /100 | #176 | Average 11.6% |
Demographics Similar to Immigrants from Barbados by Unemployment Among Youth under 25 years
In terms of unemployment among youth under 25 years, the demographic groups most similar to Immigrants from Barbados are British West Indian (15.5%, a difference of 2.1%), Immigrants from Dominican Republic (15.6%, a difference of 2.2%), Alaska Native (14.9%, a difference of 2.2%), Immigrants from Yemen (15.6%, a difference of 2.3%), and Yakama (15.6%, a difference of 2.3%).
| Demographics | Rating | Rank | Unemployment Among Youth under 25 years |
| West Indians | 0.0 /100 | #319 | Tragic 14.6% |
| Barbadians | 0.0 /100 | #320 | Tragic 14.6% |
| Cheyenne | 0.0 /100 | #321 | Tragic 14.6% |
| Trinidadians and Tobagonians | 0.0 /100 | #322 | Tragic 14.6% |
| Immigrants | Trinidad and Tobago | 0.0 /100 | #323 | Tragic 14.6% |
| Immigrants | Jamaica | 0.0 /100 | #324 | Tragic 14.8% |
| Alaska Natives | 0.0 /100 | #325 | Tragic 14.9% |
| Immigrants | Barbados | 0.0 /100 | #326 | Tragic 15.2% |
| British West Indians | 0.0 /100 | #327 | Tragic 15.5% |
| Immigrants | Dominican Republic | 0.0 /100 | #328 | Tragic 15.6% |
| Immigrants | Yemen | 0.0 /100 | #329 | Tragic 15.6% |
| Yakama | 0.0 /100 | #330 | Tragic 15.6% |
| Dominicans | 0.0 /100 | #331 | Tragic 15.7% |
| Immigrants | Grenada | 0.0 /100 | #332 | Tragic 15.8% |
| Guyanese | 0.0 /100 | #333 | Tragic 15.9% |