Dutch West Indian vs Immigrants from Argentina Male Unemployment
COMPARE
Dutch West Indian
Immigrants from Argentina
Male Unemployment
Male Unemployment Comparison
Dutch West Indians
Immigrants from Argentina
5.8%
MALE UNEMPLOYMENT
0.1/ 100
METRIC RATING
258th/ 347
METRIC RANK
5.0%
MALE UNEMPLOYMENT
98.1/ 100
METRIC RATING
60th/ 347
METRIC RANK
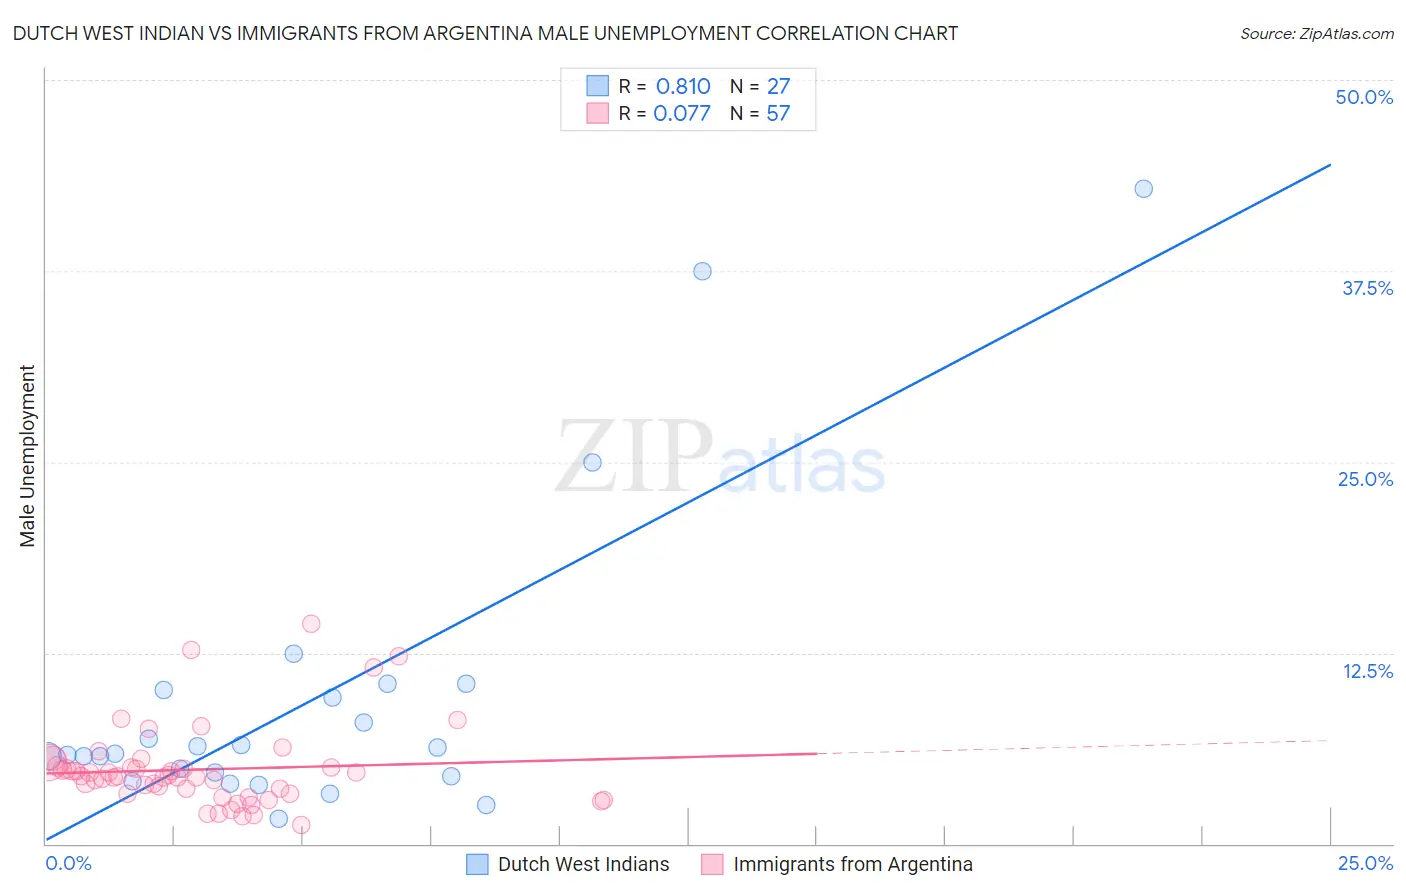
Dutch West Indian vs Immigrants from Argentina Male Unemployment Correlation Chart
The statistical analysis conducted on geographies consisting of 85,545,191 people shows a very strong positive correlation between the proportion of Dutch West Indians and unemployment rate among males in the United States with a correlation coefficient (R) of 0.810 and weighted average of 5.8%. Similarly, the statistical analysis conducted on geographies consisting of 264,057,783 people shows a slight positive correlation between the proportion of Immigrants from Argentina and unemployment rate among males in the United States with a correlation coefficient (R) of 0.077 and weighted average of 5.0%, a difference of 16.5%.
Male Unemployment Correlation Summary
| Measurement | Dutch West Indian | Immigrants from Argentina |
| Minimum | 1.6% | 1.2% |
| Maximum | 42.9% | 14.4% |
| Range | 41.3% | 13.2% |
| Mean | 9.4% | 4.9% |
| Median | 5.9% | 4.4% |
| Interquartile 25% (IQ1) | 4.4% | 3.3% |
| Interquartile 75% (IQ3) | 10.1% | 5.1% |
| Interquartile Range (IQR) | 5.7% | 1.8% |
| Standard Deviation (Sample) | 9.9% | 2.7% |
| Standard Deviation (Population) | 9.8% | 2.6% |
Similar Demographics by Male Unemployment
Demographics Similar to Dutch West Indians by Male Unemployment
In terms of male unemployment, the demographic groups most similar to Dutch West Indians are Hispanic or Latino (5.8%, a difference of 0.14%), Cajun (5.8%, a difference of 0.15%), Immigrants from Central America (5.8%, a difference of 0.21%), Comanche (5.8%, a difference of 0.30%), and Kiowa (5.8%, a difference of 0.38%).
| Demographics | Rating | Rank | Male Unemployment |
| Spanish Americans | 0.3 /100 | #251 | Tragic 5.7% |
| Mexicans | 0.2 /100 | #252 | Tragic 5.8% |
| Mexican American Indians | 0.2 /100 | #253 | Tragic 5.8% |
| Japanese | 0.2 /100 | #254 | Tragic 5.8% |
| Kiowa | 0.2 /100 | #255 | Tragic 5.8% |
| Comanche | 0.2 /100 | #256 | Tragic 5.8% |
| Hispanics or Latinos | 0.1 /100 | #257 | Tragic 5.8% |
| Dutch West Indians | 0.1 /100 | #258 | Tragic 5.8% |
| Cajuns | 0.1 /100 | #259 | Tragic 5.8% |
| Immigrants | Central America | 0.1 /100 | #260 | Tragic 5.8% |
| Liberians | 0.1 /100 | #261 | Tragic 5.8% |
| Immigrants | Portugal | 0.1 /100 | #262 | Tragic 5.9% |
| Immigrants | Latin America | 0.1 /100 | #263 | Tragic 5.9% |
| Immigrants | Mexico | 0.0 /100 | #264 | Tragic 5.9% |
| French American Indians | 0.0 /100 | #265 | Tragic 5.9% |
Demographics Similar to Immigrants from Argentina by Male Unemployment
In terms of male unemployment, the demographic groups most similar to Immigrants from Argentina are Cambodian (5.0%, a difference of 0.080%), Immigrants from Netherlands (5.0%, a difference of 0.18%), Basque (5.0%, a difference of 0.20%), Eastern European (5.0%, a difference of 0.22%), and Celtic (5.0%, a difference of 0.24%).
| Demographics | Rating | Rank | Male Unemployment |
| Jordanians | 98.8 /100 | #53 | Exceptional 5.0% |
| Yugoslavians | 98.7 /100 | #54 | Exceptional 5.0% |
| Czechoslovakians | 98.7 /100 | #55 | Exceptional 5.0% |
| Immigrants | Bulgaria | 98.7 /100 | #56 | Exceptional 5.0% |
| Turks | 98.5 /100 | #57 | Exceptional 5.0% |
| Lithuanians | 98.5 /100 | #58 | Exceptional 5.0% |
| Immigrants | Netherlands | 98.3 /100 | #59 | Exceptional 5.0% |
| Immigrants | Argentina | 98.1 /100 | #60 | Exceptional 5.0% |
| Cambodians | 98.1 /100 | #61 | Exceptional 5.0% |
| Basques | 97.9 /100 | #62 | Exceptional 5.0% |
| Eastern Europeans | 97.9 /100 | #63 | Exceptional 5.0% |
| Celtics | 97.8 /100 | #64 | Exceptional 5.0% |
| Icelanders | 97.6 /100 | #65 | Exceptional 5.0% |
| Finns | 97.5 /100 | #66 | Exceptional 5.0% |
| Immigrants | Canada | 97.5 /100 | #67 | Exceptional 5.0% |