Immigrants from Western Asia vs Sri Lankan Male Unemployment
COMPARE
Immigrants from Western Asia
Sri Lankan
Male Unemployment
Male Unemployment Comparison
Immigrants from Western Asia
Sri Lankans
5.6%
MALE UNEMPLOYMENT
3.5/ 100
METRIC RATING
219th/ 347
METRIC RANK
5.2%
MALE UNEMPLOYMENT
77.9/ 100
METRIC RATING
144th/ 347
METRIC RANK
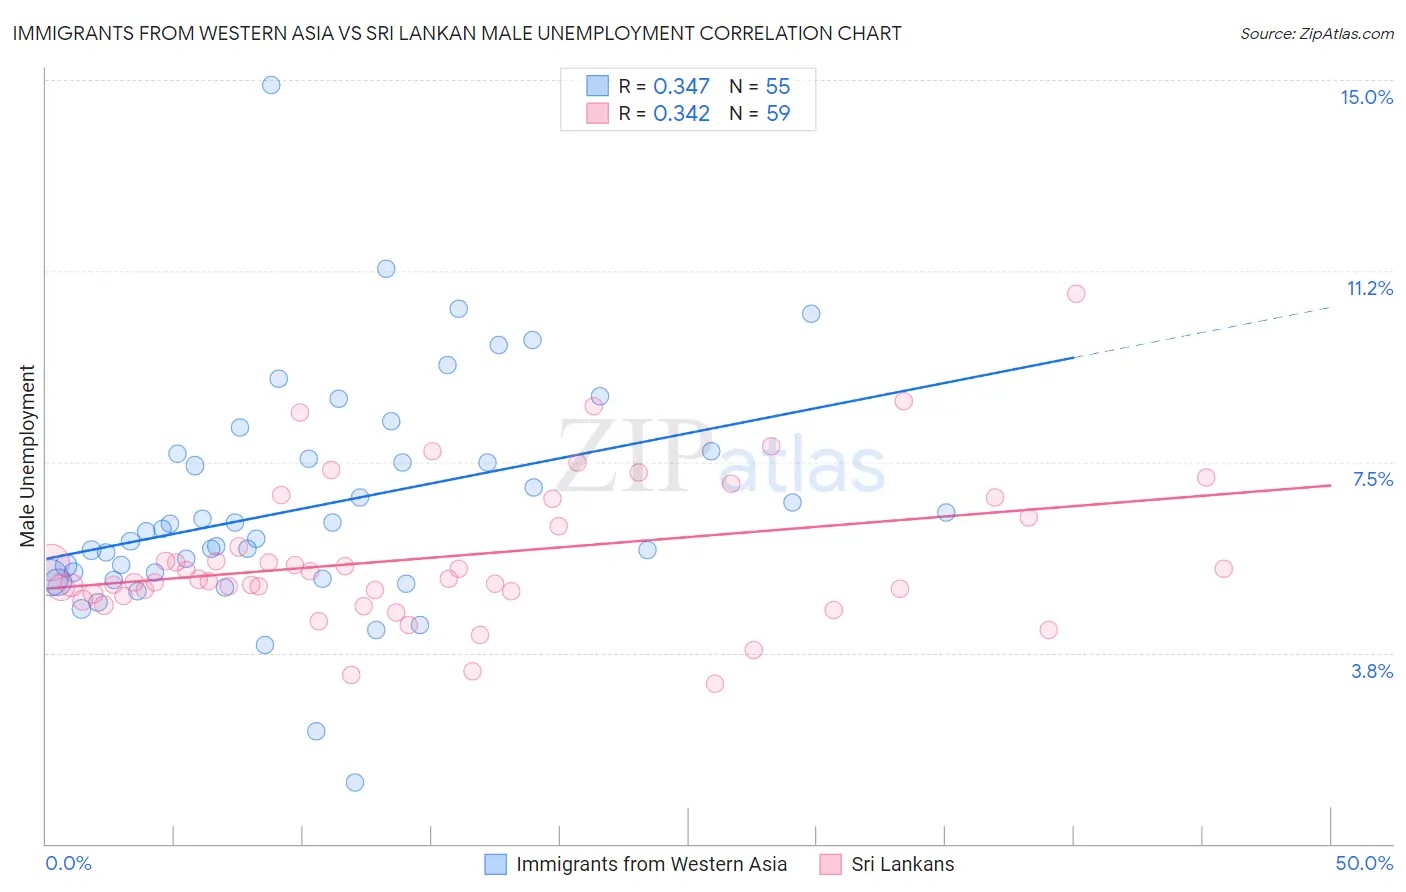
Immigrants from Western Asia vs Sri Lankan Male Unemployment Correlation Chart
The statistical analysis conducted on geographies consisting of 403,036,222 people shows a mild positive correlation between the proportion of Immigrants from Western Asia and unemployment rate among males in the United States with a correlation coefficient (R) of 0.347 and weighted average of 5.6%. Similarly, the statistical analysis conducted on geographies consisting of 438,393,028 people shows a mild positive correlation between the proportion of Sri Lankans and unemployment rate among males in the United States with a correlation coefficient (R) of 0.342 and weighted average of 5.2%, a difference of 6.8%.
Male Unemployment Correlation Summary
| Measurement | Immigrants from Western Asia | Sri Lankan |
| Minimum | 1.2% | 3.1% |
| Maximum | 14.9% | 10.8% |
| Range | 13.7% | 7.7% |
| Mean | 6.6% | 5.6% |
| Median | 6.1% | 5.2% |
| Interquartile 25% (IQ1) | 5.2% | 4.9% |
| Interquartile 75% (IQ3) | 7.6% | 6.4% |
| Interquartile Range (IQR) | 2.4% | 1.5% |
| Standard Deviation (Sample) | 2.3% | 1.4% |
| Standard Deviation (Population) | 2.3% | 1.4% |
Similar Demographics by Male Unemployment
Demographics Similar to Immigrants from Western Asia by Male Unemployment
In terms of male unemployment, the demographic groups most similar to Immigrants from Western Asia are Portuguese (5.6%, a difference of 0.030%), Immigrants from Albania (5.5%, a difference of 0.050%), Soviet Union (5.6%, a difference of 0.13%), Delaware (5.5%, a difference of 0.25%), and Immigrants from Micronesia (5.6%, a difference of 0.27%).
| Demographics | Rating | Rank | Male Unemployment |
| Hmong | 7.0 /100 | #212 | Tragic 5.5% |
| Ugandans | 6.3 /100 | #213 | Tragic 5.5% |
| Puget Sound Salish | 5.6 /100 | #214 | Tragic 5.5% |
| Samoans | 4.9 /100 | #215 | Tragic 5.5% |
| Immigrants | Immigrants | 4.3 /100 | #216 | Tragic 5.5% |
| Delaware | 4.2 /100 | #217 | Tragic 5.5% |
| Immigrants | Albania | 3.6 /100 | #218 | Tragic 5.5% |
| Immigrants | Western Asia | 3.5 /100 | #219 | Tragic 5.6% |
| Portuguese | 3.5 /100 | #220 | Tragic 5.6% |
| Soviet Union | 3.2 /100 | #221 | Tragic 5.6% |
| Immigrants | Micronesia | 2.9 /100 | #222 | Tragic 5.6% |
| Creek | 2.6 /100 | #223 | Tragic 5.6% |
| Cherokee | 2.4 /100 | #224 | Tragic 5.6% |
| Panamanians | 1.9 /100 | #225 | Tragic 5.6% |
| Immigrants | Cambodia | 1.8 /100 | #226 | Tragic 5.6% |
Demographics Similar to Sri Lankans by Male Unemployment
In terms of male unemployment, the demographic groups most similar to Sri Lankans are Syrian (5.2%, a difference of 0.010%), Macedonian (5.2%, a difference of 0.010%), Immigrants from Kenya (5.2%, a difference of 0.020%), Fijian (5.2%, a difference of 0.030%), and Immigrants from Burma/Myanmar (5.2%, a difference of 0.030%).
| Demographics | Rating | Rank | Male Unemployment |
| Immigrants | Eastern Africa | 79.8 /100 | #137 | Good 5.2% |
| Immigrants | Croatia | 79.7 /100 | #138 | Good 5.2% |
| Kenyans | 79.4 /100 | #139 | Good 5.2% |
| Brazilians | 79.3 /100 | #140 | Good 5.2% |
| Immigrants | Switzerland | 79.2 /100 | #141 | Good 5.2% |
| Fijians | 78.3 /100 | #142 | Good 5.2% |
| Syrians | 78.0 /100 | #143 | Good 5.2% |
| Sri Lankans | 77.9 /100 | #144 | Good 5.2% |
| Macedonians | 77.7 /100 | #145 | Good 5.2% |
| Immigrants | Kenya | 77.6 /100 | #146 | Good 5.2% |
| Immigrants | Burma/Myanmar | 77.5 /100 | #147 | Good 5.2% |
| Immigrants | Italy | 76.3 /100 | #148 | Good 5.2% |
| Immigrants | Europe | 76.2 /100 | #149 | Good 5.2% |
| Indians (Asian) | 76.0 /100 | #150 | Good 5.2% |
| Slovaks | 75.5 /100 | #151 | Good 5.2% |