Immigrants from Europe vs Nigerian Unemployment Among Ages 20 to 24 years
COMPARE
Immigrants from Europe
Nigerian
Unemployment Among Ages 20 to 24 years
Unemployment Among Ages 20 to 24 years Comparison
Immigrants from Europe
Nigerians
10.4%
UNEMPLOYMENT AMONG AGES 20 TO 24 YEARS
18.5/ 100
METRIC RATING
206th/ 347
METRIC RANK
11.4%
UNEMPLOYMENT AMONG AGES 20 TO 24 YEARS
0.0/ 100
METRIC RATING
272nd/ 347
METRIC RANK
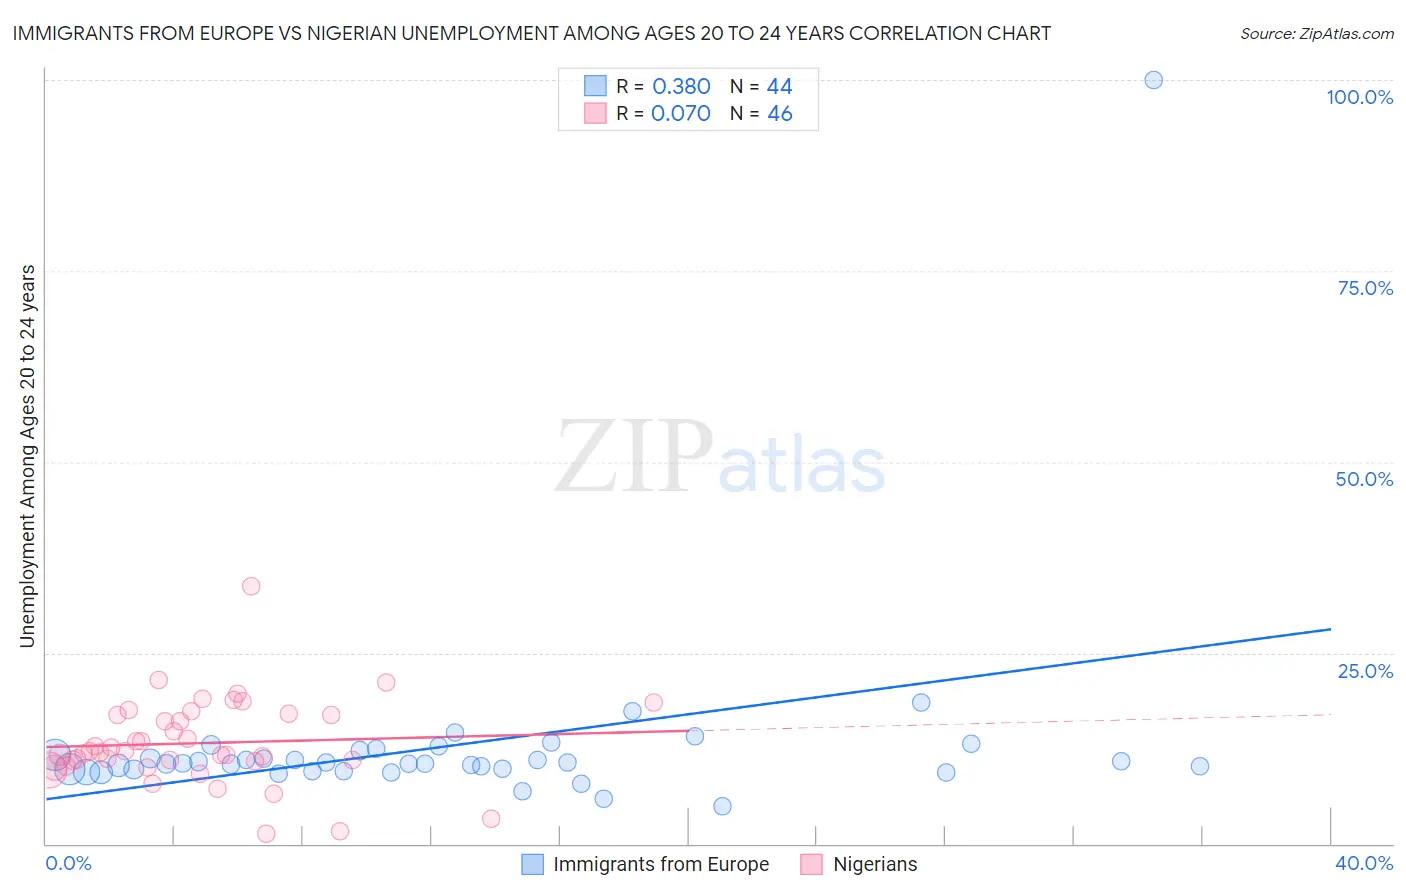
Immigrants from Europe vs Nigerian Unemployment Among Ages 20 to 24 years Correlation Chart
The statistical analysis conducted on geographies consisting of 510,398,062 people shows a mild positive correlation between the proportion of Immigrants from Europe and unemployment rate among population between the ages 20 and 24 in the United States with a correlation coefficient (R) of 0.380 and weighted average of 10.4%. Similarly, the statistical analysis conducted on geographies consisting of 327,356,401 people shows a slight positive correlation between the proportion of Nigerians and unemployment rate among population between the ages 20 and 24 in the United States with a correlation coefficient (R) of 0.070 and weighted average of 11.4%, a difference of 9.2%.
Unemployment Among Ages 20 to 24 years Correlation Summary
| Measurement | Immigrants from Europe | Nigerian |
| Minimum | 4.9% | 1.3% |
| Maximum | 100.0% | 33.7% |
| Range | 95.1% | 32.4% |
| Mean | 12.8% | 13.2% |
| Median | 10.5% | 12.0% |
| Interquartile 25% (IQ1) | 9.6% | 10.7% |
| Interquartile 75% (IQ3) | 11.9% | 16.9% |
| Interquartile Range (IQR) | 2.2% | 6.1% |
| Standard Deviation (Sample) | 13.7% | 5.6% |
| Standard Deviation (Population) | 13.5% | 5.5% |
Similar Demographics by Unemployment Among Ages 20 to 24 years
Demographics Similar to Immigrants from Europe by Unemployment Among Ages 20 to 24 years
In terms of unemployment among ages 20 to 24 years, the demographic groups most similar to Immigrants from Europe are Cypriot (10.4%, a difference of 0.030%), Immigrants from Honduras (10.4%, a difference of 0.030%), Immigrants from Northern Europe (10.4%, a difference of 0.060%), Immigrants from Hong Kong (10.5%, a difference of 0.060%), and Peruvian (10.5%, a difference of 0.080%).
| Demographics | Rating | Rank | Unemployment Among Ages 20 to 24 years |
| Portuguese | 21.8 /100 | #199 | Fair 10.4% |
| Russians | 21.2 /100 | #200 | Fair 10.4% |
| Immigrants | Peru | 21.2 /100 | #201 | Fair 10.4% |
| Immigrants | Middle Africa | 20.9 /100 | #202 | Fair 10.4% |
| South Americans | 20.6 /100 | #203 | Fair 10.4% |
| Immigrants | Northern Europe | 19.5 /100 | #204 | Poor 10.4% |
| Cypriots | 18.9 /100 | #205 | Poor 10.4% |
| Immigrants | Europe | 18.5 /100 | #206 | Poor 10.4% |
| Immigrants | Honduras | 17.9 /100 | #207 | Poor 10.4% |
| Immigrants | Hong Kong | 17.6 /100 | #208 | Poor 10.5% |
| Peruvians | 17.2 /100 | #209 | Poor 10.5% |
| Immigrants | Belgium | 16.9 /100 | #210 | Poor 10.5% |
| Immigrants | Guatemala | 14.6 /100 | #211 | Poor 10.5% |
| Immigrants | Sri Lanka | 14.0 /100 | #212 | Poor 10.5% |
| Guatemalans | 12.2 /100 | #213 | Poor 10.5% |
Demographics Similar to Nigerians by Unemployment Among Ages 20 to 24 years
In terms of unemployment among ages 20 to 24 years, the demographic groups most similar to Nigerians are Immigrants from Uzbekistan (11.4%, a difference of 0.030%), Immigrants from Nigeria (11.5%, a difference of 0.61%), Cape Verdean (11.5%, a difference of 0.69%), Senegalese (11.5%, a difference of 1.1%), and Sierra Leonean (11.5%, a difference of 1.1%).
| Demographics | Rating | Rank | Unemployment Among Ages 20 to 24 years |
| Immigrants | Ireland | 0.0 /100 | #265 | Tragic 11.1% |
| Immigrants | Liberia | 0.0 /100 | #266 | Tragic 11.1% |
| Immigrants | Greece | 0.0 /100 | #267 | Tragic 11.1% |
| Maltese | 0.0 /100 | #268 | Tragic 11.2% |
| Ute | 0.0 /100 | #269 | Tragic 11.2% |
| Delaware | 0.0 /100 | #270 | Tragic 11.3% |
| Immigrants | Uzbekistan | 0.0 /100 | #271 | Tragic 11.4% |
| Nigerians | 0.0 /100 | #272 | Tragic 11.4% |
| Immigrants | Nigeria | 0.0 /100 | #273 | Tragic 11.5% |
| Cape Verdeans | 0.0 /100 | #274 | Tragic 11.5% |
| Senegalese | 0.0 /100 | #275 | Tragic 11.5% |
| Sierra Leoneans | 0.0 /100 | #276 | Tragic 11.5% |
| Africans | 0.0 /100 | #277 | Tragic 11.5% |
| Colville | 0.0 /100 | #278 | Tragic 11.6% |
| Bahamians | 0.0 /100 | #279 | Tragic 11.6% |