Immigrants vs Immigrants from Uruguay Unemployment Among Women with Children Ages 6 to 17 years
COMPARE
Immigrants
Immigrants from Uruguay
Unemployment Among Women with Children Ages 6 to 17 years
Unemployment Among Women with Children Ages 6 to 17 years Comparison
Immigrants
Immigrants from Uruguay
9.1%
UNEMPLOYMENT AMONG WOMEN WITH CHILDREN AGES 6 TO 17 YEARS
29.2/ 100
METRIC RATING
189th/ 347
METRIC RANK
9.2%
UNEMPLOYMENT AMONG WOMEN WITH CHILDREN AGES 6 TO 17 YEARS
7.2/ 100
METRIC RATING
216th/ 347
METRIC RANK
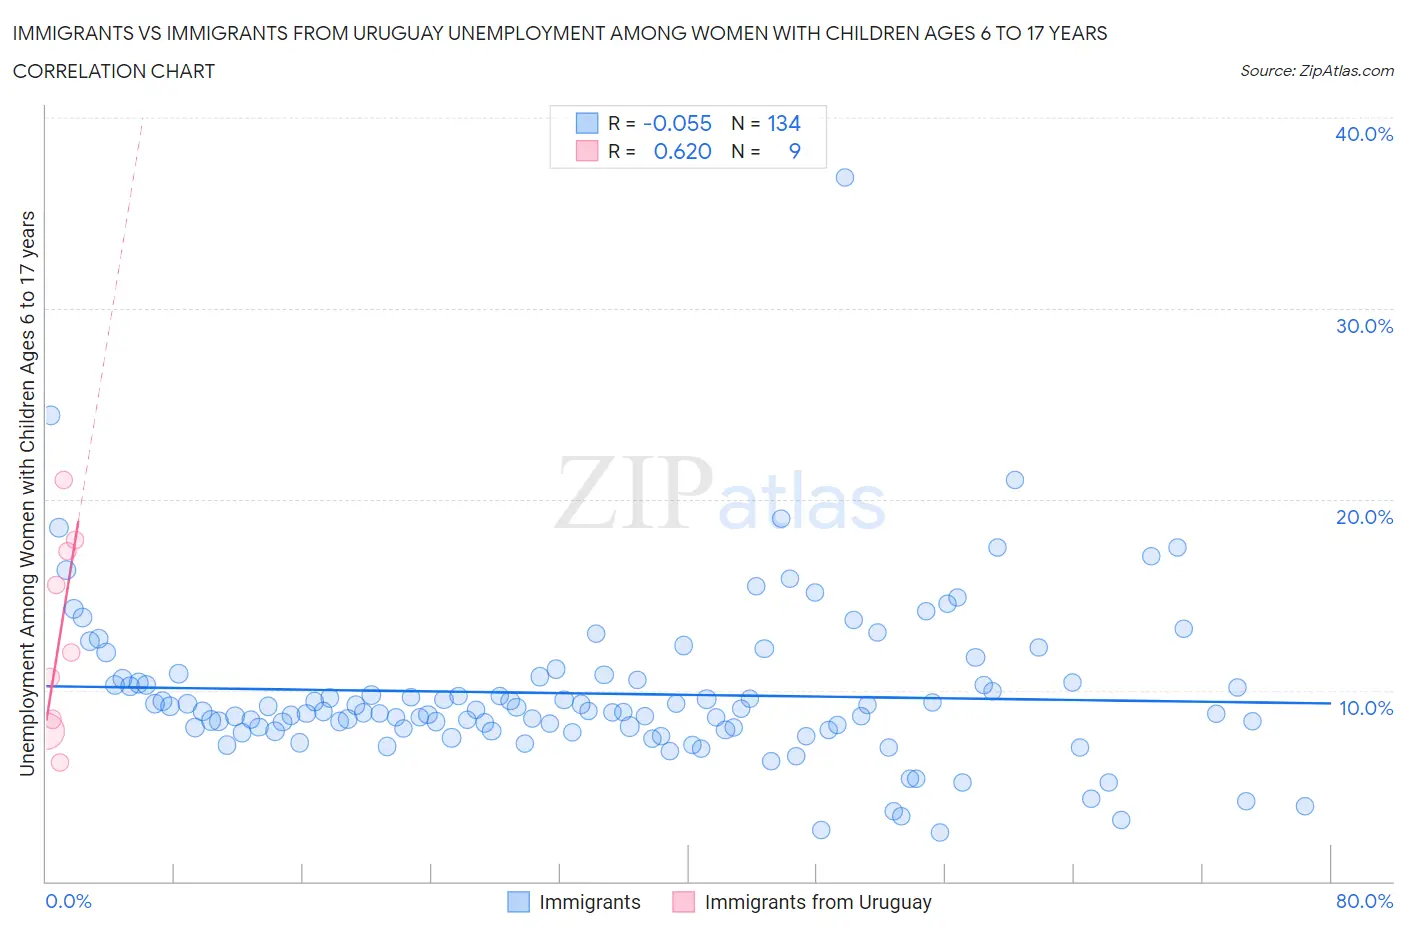
Immigrants vs Immigrants from Uruguay Unemployment Among Women with Children Ages 6 to 17 years Correlation Chart
The statistical analysis conducted on geographies consisting of 360,845,449 people shows a slight negative correlation between the proportion of Immigrants and unemployment rate among women with children between the ages 6 and 17 in the United States with a correlation coefficient (R) of -0.055 and weighted average of 9.1%. Similarly, the statistical analysis conducted on geographies consisting of 113,048,827 people shows a significant positive correlation between the proportion of Immigrants from Uruguay and unemployment rate among women with children between the ages 6 and 17 in the United States with a correlation coefficient (R) of 0.620 and weighted average of 9.2%, a difference of 1.8%.
Unemployment Among Women with Children Ages 6 to 17 years Correlation Summary
| Measurement | Immigrants | Immigrants from Uruguay |
| Minimum | 2.6% | 6.2% |
| Maximum | 36.8% | 21.0% |
| Range | 34.3% | 14.8% |
| Mean | 9.8% | 13.0% |
| Median | 8.9% | 12.0% |
| Interquartile 25% (IQ1) | 8.0% | 8.2% |
| Interquartile 75% (IQ3) | 10.5% | 17.6% |
| Interquartile Range (IQR) | 2.5% | 9.4% |
| Standard Deviation (Sample) | 4.2% | 5.1% |
| Standard Deviation (Population) | 4.2% | 4.9% |
Similar Demographics by Unemployment Among Women with Children Ages 6 to 17 years
Demographics Similar to Immigrants by Unemployment Among Women with Children Ages 6 to 17 years
In terms of unemployment among women with children ages 6 to 17 years, the demographic groups most similar to Immigrants are Immigrants from Syria (9.1%, a difference of 0.030%), Slovene (9.1%, a difference of 0.040%), Belizean (9.1%, a difference of 0.040%), Comanche (9.0%, a difference of 0.050%), and Guamanian/Chamorro (9.1%, a difference of 0.11%).
| Demographics | Rating | Rank | Unemployment Among Women with Children Ages 6 to 17 years |
| South American Indians | 34.4 /100 | #182 | Fair 9.0% |
| Swiss | 33.5 /100 | #183 | Fair 9.0% |
| Palestinians | 33.4 /100 | #184 | Fair 9.0% |
| Immigrants | Congo | 32.5 /100 | #185 | Fair 9.0% |
| Immigrants | Spain | 32.4 /100 | #186 | Fair 9.0% |
| Comanche | 30.0 /100 | #187 | Fair 9.0% |
| Immigrants | Syria | 29.7 /100 | #188 | Fair 9.1% |
| Immigrants | Immigrants | 29.2 /100 | #189 | Fair 9.1% |
| Slovenes | 28.5 /100 | #190 | Fair 9.1% |
| Belizeans | 28.4 /100 | #191 | Fair 9.1% |
| Guamanians/Chamorros | 27.2 /100 | #192 | Fair 9.1% |
| Immigrants | Turkey | 25.8 /100 | #193 | Fair 9.1% |
| Immigrants | Kazakhstan | 25.3 /100 | #194 | Fair 9.1% |
| Austrians | 25.0 /100 | #195 | Fair 9.1% |
| Brazilians | 24.4 /100 | #196 | Fair 9.1% |
Demographics Similar to Immigrants from Uruguay by Unemployment Among Women with Children Ages 6 to 17 years
In terms of unemployment among women with children ages 6 to 17 years, the demographic groups most similar to Immigrants from Uruguay are Immigrants from Germany (9.2%, a difference of 0.0%), German (9.2%, a difference of 0.010%), Iroquois (9.2%, a difference of 0.040%), Syrian (9.2%, a difference of 0.060%), and Immigrants from Scotland (9.2%, a difference of 0.11%).
| Demographics | Rating | Rank | Unemployment Among Women with Children Ages 6 to 17 years |
| Salvadorans | 10.7 /100 | #209 | Poor 9.2% |
| Finns | 10.0 /100 | #210 | Tragic 9.2% |
| Immigrants | Cuba | 9.6 /100 | #211 | Tragic 9.2% |
| Peruvians | 9.0 /100 | #212 | Tragic 9.2% |
| Spaniards | 8.2 /100 | #213 | Tragic 9.2% |
| Iroquois | 7.5 /100 | #214 | Tragic 9.2% |
| Immigrants | Germany | 7.2 /100 | #215 | Tragic 9.2% |
| Immigrants | Uruguay | 7.2 /100 | #216 | Tragic 9.2% |
| Germans | 7.2 /100 | #217 | Tragic 9.2% |
| Syrians | 6.9 /100 | #218 | Tragic 9.2% |
| Immigrants | Scotland | 6.6 /100 | #219 | Tragic 9.2% |
| Belgians | 6.4 /100 | #220 | Tragic 9.2% |
| Crow | 5.8 /100 | #221 | Tragic 9.2% |
| Immigrants | Southern Europe | 5.8 /100 | #222 | Tragic 9.2% |
| Immigrants | Eritrea | 5.8 /100 | #223 | Tragic 9.2% |