Dutch West Indian vs Immigrants from Argentina Family Households
COMPARE
Dutch West Indian
Immigrants from Argentina
Family Households
Family Households Comparison
Dutch West Indians
Immigrants from Argentina
64.3%
FAMILY HOUSEHOLDS
53.9/ 100
METRIC RATING
172nd/ 347
METRIC RANK
64.9%
FAMILY HOUSEHOLDS
92.8/ 100
METRIC RATING
124th/ 347
METRIC RANK
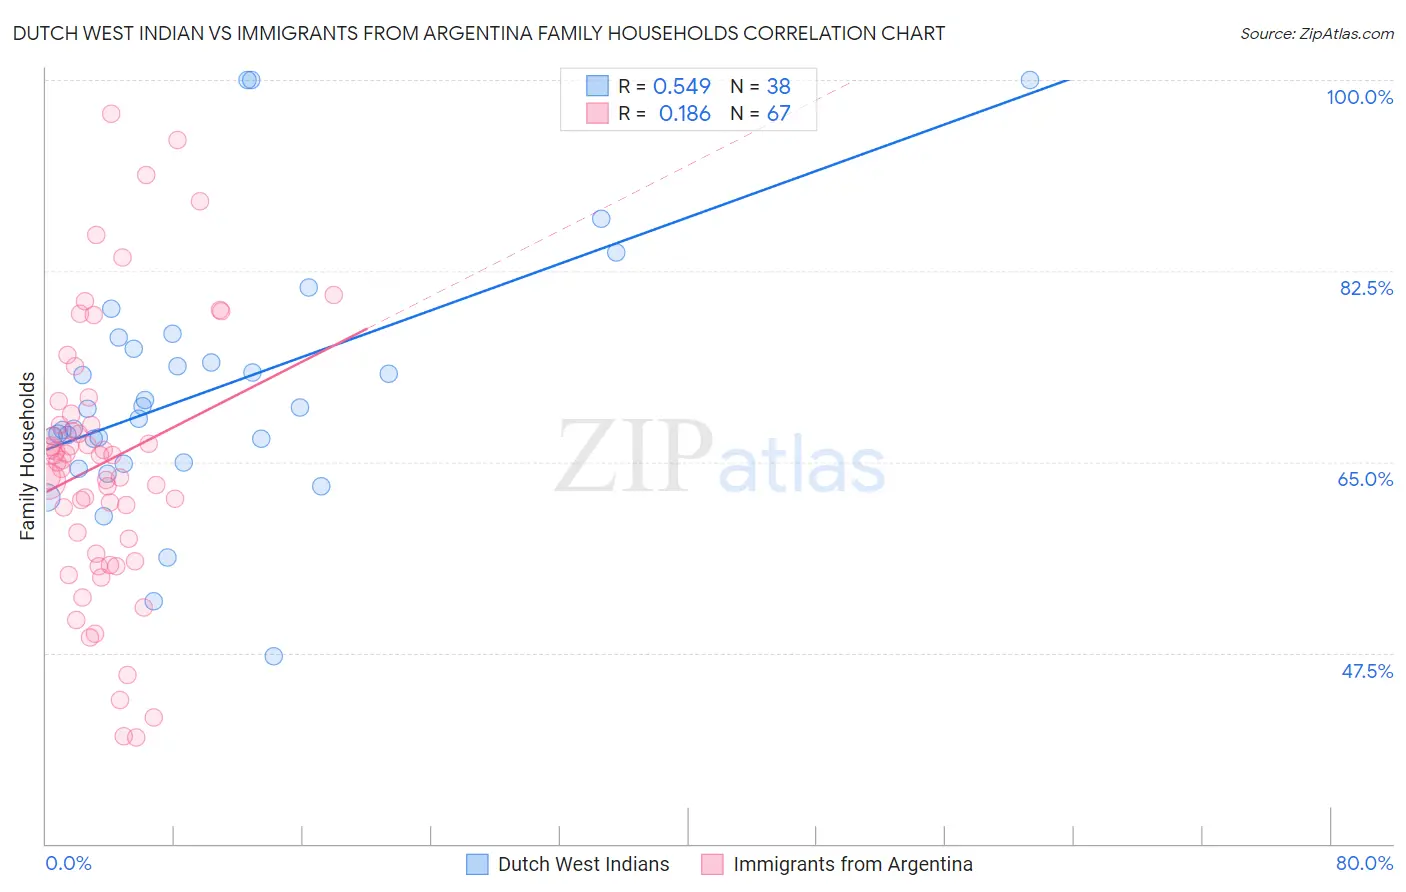
Dutch West Indian vs Immigrants from Argentina Family Households Correlation Chart
The statistical analysis conducted on geographies consisting of 85,766,530 people shows a substantial positive correlation between the proportion of Dutch West Indians and percentage of family households in the United States with a correlation coefficient (R) of 0.549 and weighted average of 64.3%. Similarly, the statistical analysis conducted on geographies consisting of 264,360,564 people shows a poor positive correlation between the proportion of Immigrants from Argentina and percentage of family households in the United States with a correlation coefficient (R) of 0.186 and weighted average of 64.9%, a difference of 0.81%.
Family Households Correlation Summary
| Measurement | Dutch West Indian | Immigrants from Argentina |
| Minimum | 47.2% | 39.7% |
| Maximum | 100.0% | 96.9% |
| Range | 52.8% | 57.2% |
| Mean | 71.4% | 64.9% |
| Median | 69.4% | 65.2% |
| Interquartile 25% (IQ1) | 65.0% | 56.6% |
| Interquartile 75% (IQ3) | 75.3% | 69.4% |
| Interquartile Range (IQR) | 10.3% | 12.8% |
| Standard Deviation (Sample) | 11.5% | 12.3% |
| Standard Deviation (Population) | 11.4% | 12.2% |
Similar Demographics by Family Households
Demographics Similar to Dutch West Indians by Family Households
In terms of family households, the demographic groups most similar to Dutch West Indians are Ute (64.3%, a difference of 0.010%), Immigrants from Sierra Leone (64.3%, a difference of 0.020%), Iraqi (64.4%, a difference of 0.030%), Armenian (64.4%, a difference of 0.030%), and Irish (64.4%, a difference of 0.050%).
| Demographics | Rating | Rank | Family Households |
| Immigrants | Southern Europe | 60.0 /100 | #165 | Good 64.4% |
| Scotch-Irish | 59.2 /100 | #166 | Average 64.4% |
| Irish | 57.9 /100 | #167 | Average 64.4% |
| Hondurans | 57.5 /100 | #168 | Average 64.4% |
| Iraqis | 56.0 /100 | #169 | Average 64.4% |
| Armenians | 55.9 /100 | #170 | Average 64.4% |
| Ute | 54.6 /100 | #171 | Average 64.3% |
| Dutch West Indians | 53.9 /100 | #172 | Average 64.3% |
| Immigrants | Sierra Leone | 52.5 /100 | #173 | Average 64.3% |
| Immigrants | Germany | 50.0 /100 | #174 | Average 64.3% |
| Bangladeshis | 44.3 /100 | #175 | Average 64.3% |
| Vietnamese | 43.6 /100 | #176 | Average 64.2% |
| Immigrants | Micronesia | 42.3 /100 | #177 | Average 64.2% |
| Jamaicans | 40.6 /100 | #178 | Average 64.2% |
| Immigrants | Ukraine | 38.2 /100 | #179 | Fair 64.2% |
Demographics Similar to Immigrants from Argentina by Family Households
In terms of family households, the demographic groups most similar to Immigrants from Argentina are Immigrants from Belize (64.9%, a difference of 0.010%), Panamanian (64.8%, a difference of 0.020%), Hmong (64.9%, a difference of 0.030%), Choctaw (64.9%, a difference of 0.030%), and Immigrants from Panama (64.8%, a difference of 0.040%).
| Demographics | Rating | Rank | Family Households |
| Cherokee | 95.3 /100 | #117 | Exceptional 65.0% |
| Dutch | 95.1 /100 | #118 | Exceptional 64.9% |
| Immigrants | Eastern Asia | 94.4 /100 | #119 | Exceptional 64.9% |
| Immigrants | Oceania | 94.2 /100 | #120 | Exceptional 64.9% |
| Hungarians | 94.0 /100 | #121 | Exceptional 64.9% |
| Hmong | 93.4 /100 | #122 | Exceptional 64.9% |
| Choctaw | 93.4 /100 | #123 | Exceptional 64.9% |
| Immigrants | Argentina | 92.8 /100 | #124 | Exceptional 64.9% |
| Immigrants | Belize | 92.7 /100 | #125 | Exceptional 64.9% |
| Panamanians | 92.4 /100 | #126 | Exceptional 64.8% |
| Immigrants | Panama | 92.0 /100 | #127 | Exceptional 64.8% |
| Italians | 91.9 /100 | #128 | Exceptional 64.8% |
| Immigrants | Ecuador | 91.4 /100 | #129 | Exceptional 64.8% |
| Immigrants | Italy | 90.2 /100 | #130 | Exceptional 64.8% |
| Immigrants | Nonimmigrants | 90.1 /100 | #131 | Exceptional 64.8% |