Dutch vs Immigrants from Saudi Arabia Unemployment Among Women with Children Under 18 years
COMPARE
Dutch
Immigrants from Saudi Arabia
Unemployment Among Women with Children Under 18 years
Unemployment Among Women with Children Under 18 years Comparison
Dutch
Immigrants from Saudi Arabia
5.0%
UNEMPLOYMENT AMONG WOMEN WITH CHILDREN UNDER 18 YEARS
99.3/ 100
METRIC RATING
32nd/ 347
METRIC RANK
5.4%
UNEMPLOYMENT AMONG WOMEN WITH CHILDREN UNDER 18 YEARS
65.0/ 100
METRIC RATING
162nd/ 347
METRIC RANK
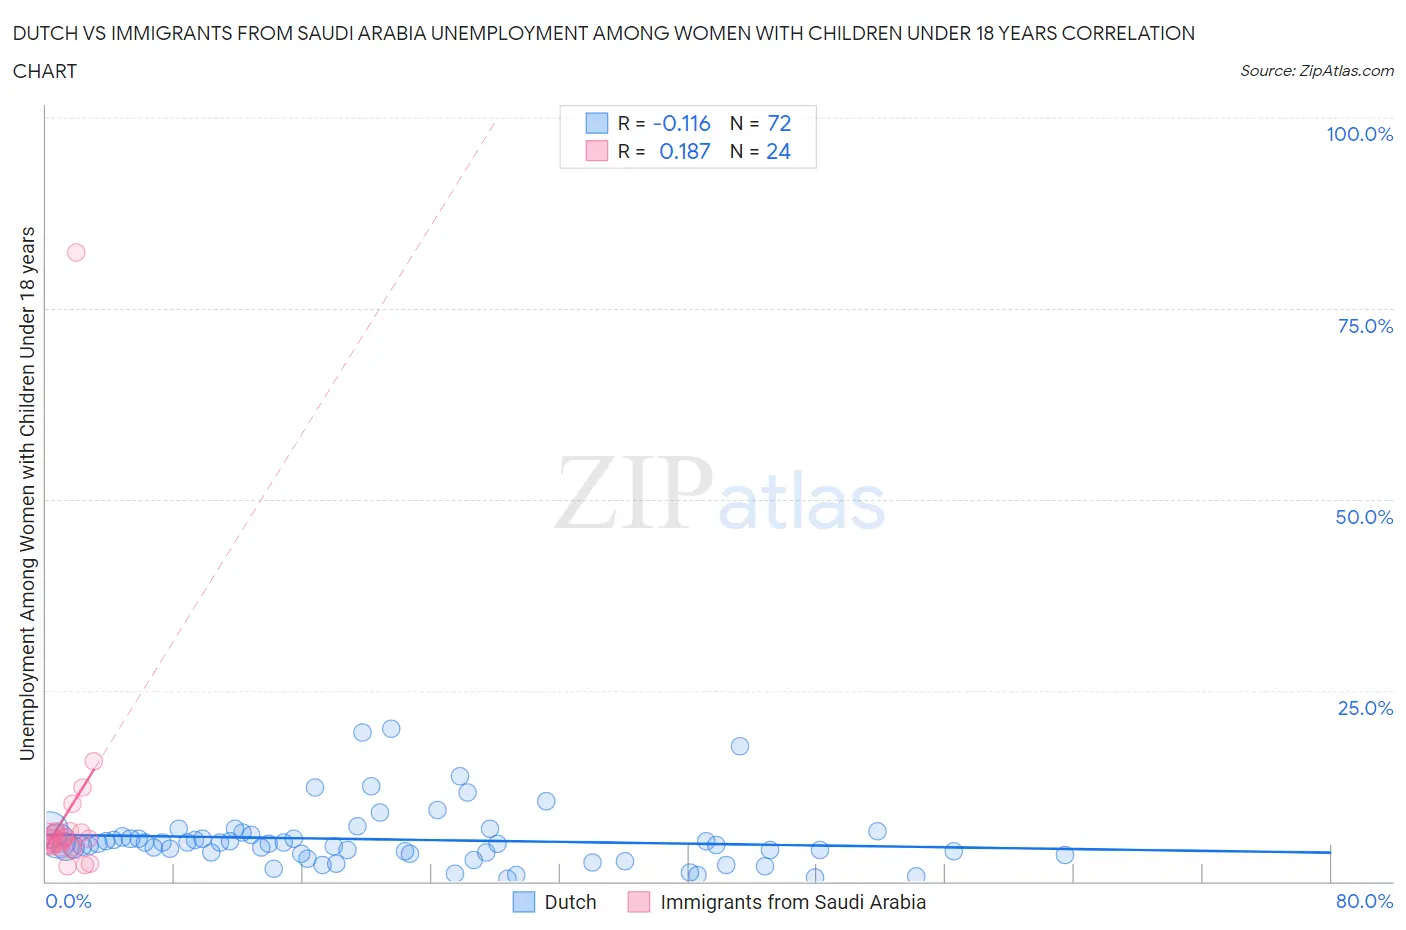
Dutch vs Immigrants from Saudi Arabia Unemployment Among Women with Children Under 18 years Correlation Chart
The statistical analysis conducted on geographies consisting of 503,486,038 people shows a poor negative correlation between the proportion of Dutch and unemployment rate among women with children under the age of 18 in the United States with a correlation coefficient (R) of -0.116 and weighted average of 5.0%. Similarly, the statistical analysis conducted on geographies consisting of 162,263,235 people shows a poor positive correlation between the proportion of Immigrants from Saudi Arabia and unemployment rate among women with children under the age of 18 in the United States with a correlation coefficient (R) of 0.187 and weighted average of 5.4%, a difference of 8.5%.
Unemployment Among Women with Children Under 18 years Correlation Summary
| Measurement | Dutch | Immigrants from Saudi Arabia |
| Minimum | 0.34% | 1.9% |
| Maximum | 20.0% | 82.4% |
| Range | 19.7% | 80.5% |
| Mean | 5.5% | 9.1% |
| Median | 4.9% | 5.5% |
| Interquartile 25% (IQ1) | 3.6% | 4.5% |
| Interquartile 75% (IQ3) | 5.9% | 6.5% |
| Interquartile Range (IQR) | 2.3% | 1.9% |
| Standard Deviation (Sample) | 3.9% | 15.9% |
| Standard Deviation (Population) | 3.9% | 15.6% |
Similar Demographics by Unemployment Among Women with Children Under 18 years
Demographics Similar to Dutch by Unemployment Among Women with Children Under 18 years
In terms of unemployment among women with children under 18 years, the demographic groups most similar to Dutch are Croatian (5.0%, a difference of 0.020%), Cypriot (5.0%, a difference of 0.11%), Immigrants from South Central Asia (5.0%, a difference of 0.22%), Luxembourger (5.0%, a difference of 0.27%), and Burmese (4.9%, a difference of 0.32%).
| Demographics | Rating | Rank | Unemployment Among Women with Children Under 18 years |
| Chinese | 99.5 /100 | #25 | Exceptional 4.9% |
| Swiss | 99.5 /100 | #26 | Exceptional 4.9% |
| Soviet Union | 99.5 /100 | #27 | Exceptional 4.9% |
| Immigrants | Eastern Asia | 99.5 /100 | #28 | Exceptional 4.9% |
| Finns | 99.4 /100 | #29 | Exceptional 4.9% |
| Burmese | 99.4 /100 | #30 | Exceptional 4.9% |
| Cypriots | 99.3 /100 | #31 | Exceptional 5.0% |
| Dutch | 99.3 /100 | #32 | Exceptional 5.0% |
| Croatians | 99.3 /100 | #33 | Exceptional 5.0% |
| Immigrants | South Central Asia | 99.2 /100 | #34 | Exceptional 5.0% |
| Luxembourgers | 99.2 /100 | #35 | Exceptional 5.0% |
| Mongolians | 99.2 /100 | #36 | Exceptional 5.0% |
| Poles | 99.2 /100 | #37 | Exceptional 5.0% |
| Bhutanese | 99.2 /100 | #38 | Exceptional 5.0% |
| English | 99.1 /100 | #39 | Exceptional 5.0% |
Demographics Similar to Immigrants from Saudi Arabia by Unemployment Among Women with Children Under 18 years
In terms of unemployment among women with children under 18 years, the demographic groups most similar to Immigrants from Saudi Arabia are Lebanese (5.4%, a difference of 0.030%), Immigrants from Iraq (5.4%, a difference of 0.070%), Afghan (5.4%, a difference of 0.12%), Celtic (5.4%, a difference of 0.16%), and Tlingit-Haida (5.4%, a difference of 0.24%).
| Demographics | Rating | Rank | Unemployment Among Women with Children Under 18 years |
| Koreans | 70.5 /100 | #155 | Good 5.4% |
| South Africans | 70.3 /100 | #156 | Good 5.4% |
| German Russians | 70.2 /100 | #157 | Good 5.4% |
| Immigrants | Burma/Myanmar | 69.5 /100 | #158 | Good 5.4% |
| Chickasaw | 68.4 /100 | #159 | Good 5.4% |
| Afghans | 66.6 /100 | #160 | Good 5.4% |
| Immigrants | Iraq | 65.9 /100 | #161 | Good 5.4% |
| Immigrants | Saudi Arabia | 65.0 /100 | #162 | Good 5.4% |
| Lebanese | 64.7 /100 | #163 | Good 5.4% |
| Celtics | 63.0 /100 | #164 | Good 5.4% |
| Tlingit-Haida | 61.9 /100 | #165 | Good 5.4% |
| Aleuts | 59.4 /100 | #166 | Average 5.4% |
| Immigrants | Denmark | 58.0 /100 | #167 | Average 5.4% |
| Immigrants | Northern Africa | 56.1 /100 | #168 | Average 5.4% |
| Immigrants | Thailand | 55.3 /100 | #169 | Average 5.4% |