Dutch vs Colville Unemployment Among Women with Children Under 18 years
COMPARE
Dutch
Colville
Unemployment Among Women with Children Under 18 years
Unemployment Among Women with Children Under 18 years Comparison
Dutch
Colville
5.0%
UNEMPLOYMENT AMONG WOMEN WITH CHILDREN UNDER 18 YEARS
99.3/ 100
METRIC RATING
32nd/ 347
METRIC RANK
7.4%
UNEMPLOYMENT AMONG WOMEN WITH CHILDREN UNDER 18 YEARS
0.0/ 100
METRIC RATING
330th/ 347
METRIC RANK
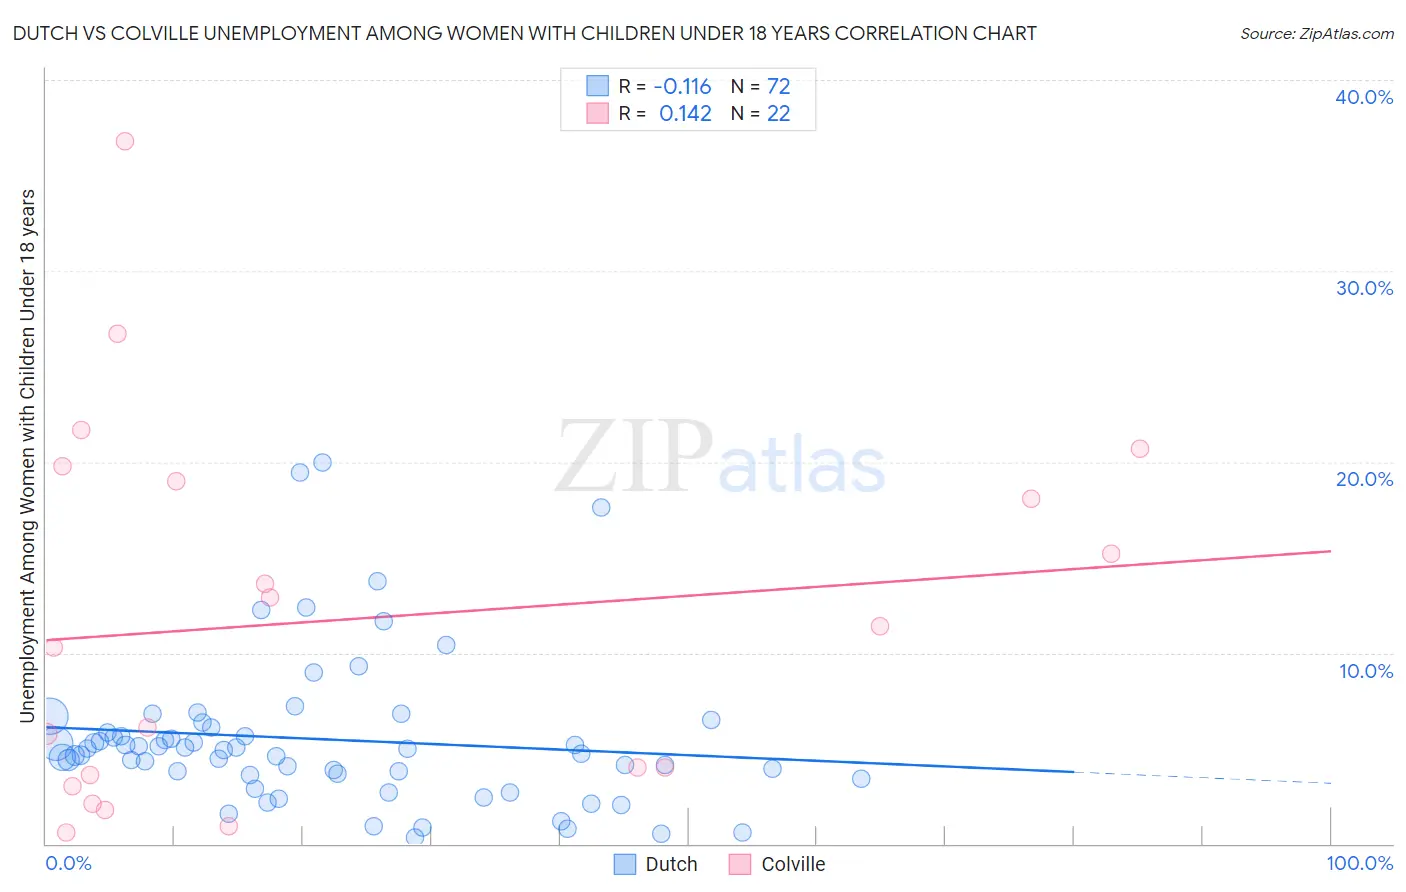
Dutch vs Colville Unemployment Among Women with Children Under 18 years Correlation Chart
The statistical analysis conducted on geographies consisting of 503,486,038 people shows a poor negative correlation between the proportion of Dutch and unemployment rate among women with children under the age of 18 in the United States with a correlation coefficient (R) of -0.116 and weighted average of 5.0%. Similarly, the statistical analysis conducted on geographies consisting of 34,331,468 people shows a poor positive correlation between the proportion of Colville and unemployment rate among women with children under the age of 18 in the United States with a correlation coefficient (R) of 0.142 and weighted average of 7.4%, a difference of 48.7%.
Unemployment Among Women with Children Under 18 years Correlation Summary
| Measurement | Dutch | Colville |
| Minimum | 0.34% | 0.60% |
| Maximum | 20.0% | 36.8% |
| Range | 19.7% | 36.2% |
| Mean | 5.5% | 11.7% |
| Median | 4.9% | 10.8% |
| Interquartile 25% (IQ1) | 3.6% | 3.6% |
| Interquartile 75% (IQ3) | 5.9% | 19.0% |
| Interquartile Range (IQR) | 2.3% | 15.4% |
| Standard Deviation (Sample) | 3.9% | 9.7% |
| Standard Deviation (Population) | 3.9% | 9.5% |
Similar Demographics by Unemployment Among Women with Children Under 18 years
Demographics Similar to Dutch by Unemployment Among Women with Children Under 18 years
In terms of unemployment among women with children under 18 years, the demographic groups most similar to Dutch are Croatian (5.0%, a difference of 0.020%), Cypriot (5.0%, a difference of 0.11%), Immigrants from South Central Asia (5.0%, a difference of 0.22%), Luxembourger (5.0%, a difference of 0.27%), and Burmese (4.9%, a difference of 0.32%).
| Demographics | Rating | Rank | Unemployment Among Women with Children Under 18 years |
| Chinese | 99.5 /100 | #25 | Exceptional 4.9% |
| Swiss | 99.5 /100 | #26 | Exceptional 4.9% |
| Soviet Union | 99.5 /100 | #27 | Exceptional 4.9% |
| Immigrants | Eastern Asia | 99.5 /100 | #28 | Exceptional 4.9% |
| Finns | 99.4 /100 | #29 | Exceptional 4.9% |
| Burmese | 99.4 /100 | #30 | Exceptional 4.9% |
| Cypriots | 99.3 /100 | #31 | Exceptional 5.0% |
| Dutch | 99.3 /100 | #32 | Exceptional 5.0% |
| Croatians | 99.3 /100 | #33 | Exceptional 5.0% |
| Immigrants | South Central Asia | 99.2 /100 | #34 | Exceptional 5.0% |
| Luxembourgers | 99.2 /100 | #35 | Exceptional 5.0% |
| Mongolians | 99.2 /100 | #36 | Exceptional 5.0% |
| Poles | 99.2 /100 | #37 | Exceptional 5.0% |
| Bhutanese | 99.2 /100 | #38 | Exceptional 5.0% |
| English | 99.1 /100 | #39 | Exceptional 5.0% |
Demographics Similar to Colville by Unemployment Among Women with Children Under 18 years
In terms of unemployment among women with children under 18 years, the demographic groups most similar to Colville are Hopi (7.4%, a difference of 0.56%), Dominican (7.5%, a difference of 1.1%), Black/African American (7.3%, a difference of 1.5%), Immigrants from Dominican Republic (7.5%, a difference of 1.5%), and Native/Alaskan (7.2%, a difference of 1.9%).
| Demographics | Rating | Rank | Unemployment Among Women with Children Under 18 years |
| Pueblo | 0.0 /100 | #323 | Tragic 6.8% |
| Paiute | 0.0 /100 | #324 | Tragic 6.9% |
| Immigrants | Dominica | 0.0 /100 | #325 | Tragic 7.0% |
| Chippewa | 0.0 /100 | #326 | Tragic 7.0% |
| Lumbee | 0.0 /100 | #327 | Tragic 7.1% |
| Natives/Alaskans | 0.0 /100 | #328 | Tragic 7.2% |
| Blacks/African Americans | 0.0 /100 | #329 | Tragic 7.3% |
| Colville | 0.0 /100 | #330 | Tragic 7.4% |
| Hopi | 0.0 /100 | #331 | Tragic 7.4% |
| Dominicans | 0.0 /100 | #332 | Tragic 7.5% |
| Immigrants | Dominican Republic | 0.0 /100 | #333 | Tragic 7.5% |
| Cheyenne | 0.0 /100 | #334 | Tragic 7.8% |
| Apache | 0.0 /100 | #335 | Tragic 7.9% |
| Sioux | 0.0 /100 | #336 | Tragic 7.9% |
| Yakama | 0.0 /100 | #337 | Tragic 8.1% |