Dutch vs Immigrants from Saudi Arabia Disability Age 35 to 64
COMPARE
Dutch
Immigrants from Saudi Arabia
Disability Age 35 to 64
Disability Age 35 to 64 Comparison
Dutch
Immigrants from Saudi Arabia
12.3%
DISABILITY AGE 35 TO 64
1.0/ 100
METRIC RATING
253rd/ 347
METRIC RANK
10.8%
DISABILITY AGE 35 TO 64
90.6/ 100
METRIC RATING
142nd/ 347
METRIC RANK
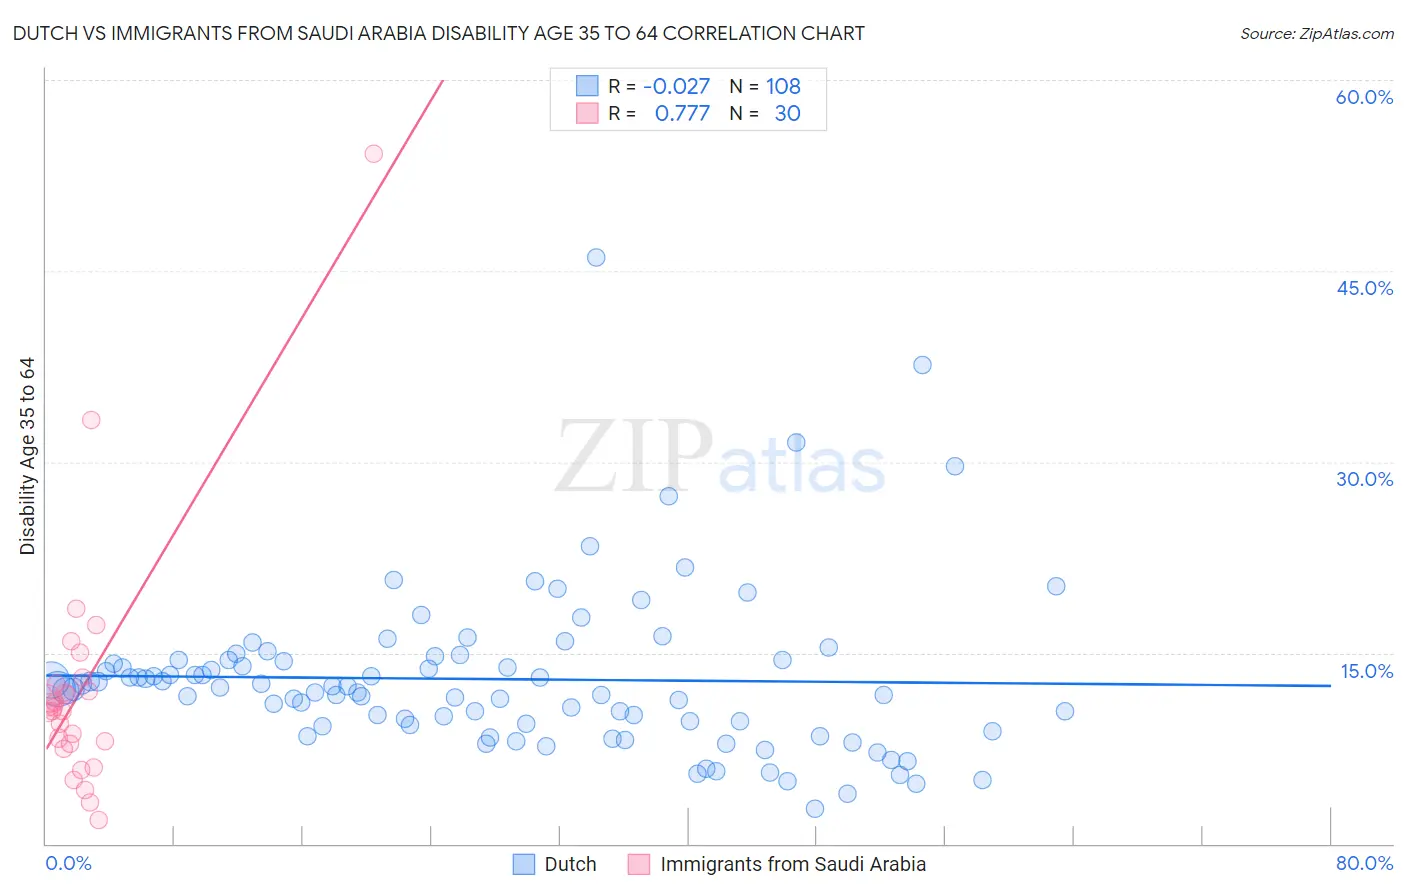
Dutch vs Immigrants from Saudi Arabia Disability Age 35 to 64 Correlation Chart
The statistical analysis conducted on geographies consisting of 553,526,448 people shows no correlation between the proportion of Dutch and percentage of population with a disability between the ages 34 and 64 in the United States with a correlation coefficient (R) of -0.027 and weighted average of 12.3%. Similarly, the statistical analysis conducted on geographies consisting of 164,212,141 people shows a strong positive correlation between the proportion of Immigrants from Saudi Arabia and percentage of population with a disability between the ages 34 and 64 in the United States with a correlation coefficient (R) of 0.777 and weighted average of 10.8%, a difference of 14.5%.
Disability Age 35 to 64 Correlation Summary
| Measurement | Dutch | Immigrants from Saudi Arabia |
| Minimum | 2.8% | 1.9% |
| Maximum | 46.0% | 54.2% |
| Range | 43.2% | 52.3% |
| Mean | 12.9% | 12.2% |
| Median | 12.2% | 10.6% |
| Interquartile 25% (IQ1) | 9.4% | 7.9% |
| Interquartile 75% (IQ3) | 14.4% | 12.6% |
| Interquartile Range (IQR) | 5.0% | 4.7% |
| Standard Deviation (Sample) | 6.4% | 9.8% |
| Standard Deviation (Population) | 6.4% | 9.6% |
Similar Demographics by Disability Age 35 to 64
Demographics Similar to Dutch by Disability Age 35 to 64
In terms of disability age 35 to 64, the demographic groups most similar to Dutch are Irish (12.3%, a difference of 0.030%), Hawaiian (12.3%, a difference of 0.11%), Japanese (12.3%, a difference of 0.25%), German (12.3%, a difference of 0.29%), and Immigrants from Burma/Myanmar (12.3%, a difference of 0.36%).
| Demographics | Rating | Rank | Disability Age 35 to 64 |
| Guamanians/Chamorros | 1.4 /100 | #246 | Tragic 12.2% |
| Immigrants | Senegal | 1.3 /100 | #247 | Tragic 12.2% |
| Spaniards | 1.3 /100 | #248 | Tragic 12.3% |
| Hispanics or Latinos | 1.3 /100 | #249 | Tragic 12.3% |
| Immigrants | Burma/Myanmar | 1.2 /100 | #250 | Tragic 12.3% |
| Germans | 1.1 /100 | #251 | Tragic 12.3% |
| Irish | 1.0 /100 | #252 | Tragic 12.3% |
| Dutch | 1.0 /100 | #253 | Tragic 12.3% |
| Hawaiians | 0.9 /100 | #254 | Tragic 12.3% |
| Japanese | 0.8 /100 | #255 | Tragic 12.3% |
| Scottish | 0.8 /100 | #256 | Tragic 12.4% |
| Mexicans | 0.7 /100 | #257 | Tragic 12.4% |
| Welsh | 0.6 /100 | #258 | Tragic 12.4% |
| English | 0.6 /100 | #259 | Tragic 12.4% |
| German Russians | 0.5 /100 | #260 | Tragic 12.5% |
Demographics Similar to Immigrants from Saudi Arabia by Disability Age 35 to 64
In terms of disability age 35 to 64, the demographic groups most similar to Immigrants from Saudi Arabia are Australian (10.8%, a difference of 0.040%), Immigrants from Scotland (10.7%, a difference of 0.17%), Sierra Leonean (10.8%, a difference of 0.21%), Costa Rican (10.7%, a difference of 0.22%), and Immigrants from Southern Europe (10.7%, a difference of 0.23%).
| Demographics | Rating | Rank | Disability Age 35 to 64 |
| Greeks | 92.3 /100 | #135 | Exceptional 10.7% |
| Salvadorans | 91.9 /100 | #136 | Exceptional 10.7% |
| Immigrants | Costa Rica | 91.7 /100 | #137 | Exceptional 10.7% |
| Immigrants | Southern Europe | 91.5 /100 | #138 | Exceptional 10.7% |
| Costa Ricans | 91.4 /100 | #139 | Exceptional 10.7% |
| Immigrants | Scotland | 91.3 /100 | #140 | Exceptional 10.7% |
| Australians | 90.7 /100 | #141 | Exceptional 10.8% |
| Immigrants | Saudi Arabia | 90.6 /100 | #142 | Exceptional 10.8% |
| Sierra Leoneans | 89.7 /100 | #143 | Excellent 10.8% |
| Lithuanians | 88.7 /100 | #144 | Excellent 10.8% |
| Immigrants | Bangladesh | 85.6 /100 | #145 | Excellent 10.9% |
| South American Indians | 83.5 /100 | #146 | Excellent 10.9% |
| Immigrants | Eritrea | 83.4 /100 | #147 | Excellent 10.9% |
| Arabs | 82.7 /100 | #148 | Excellent 10.9% |
| Immigrants | Cameroon | 81.1 /100 | #149 | Excellent 10.9% |