U.S. Virgin Islander vs Immigrants from Saudi Arabia Unemployment Among Women with Children Under 18 years
COMPARE
U.S. Virgin Islander
Immigrants from Saudi Arabia
Unemployment Among Women with Children Under 18 years
Unemployment Among Women with Children Under 18 years Comparison
U.S. Virgin Islanders
Immigrants from Saudi Arabia
6.7%
UNEMPLOYMENT AMONG WOMEN WITH CHILDREN UNDER 18 YEARS
0.0/ 100
METRIC RATING
321st/ 347
METRIC RANK
5.4%
UNEMPLOYMENT AMONG WOMEN WITH CHILDREN UNDER 18 YEARS
65.0/ 100
METRIC RATING
162nd/ 347
METRIC RANK
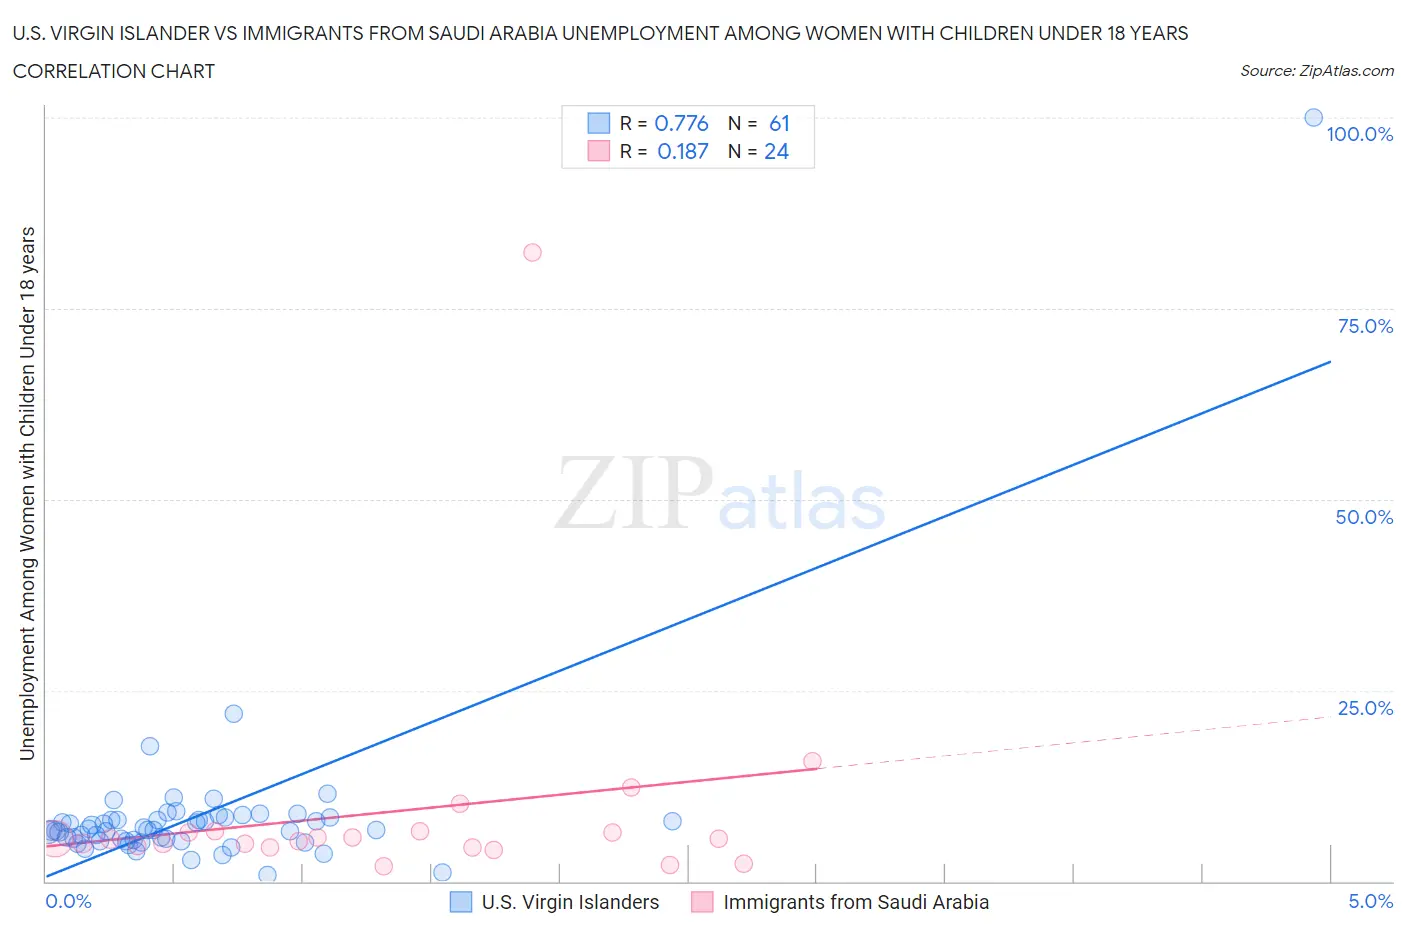
U.S. Virgin Islander vs Immigrants from Saudi Arabia Unemployment Among Women with Children Under 18 years Correlation Chart
The statistical analysis conducted on geographies consisting of 86,931,523 people shows a strong positive correlation between the proportion of U.S. Virgin Islanders and unemployment rate among women with children under the age of 18 in the United States with a correlation coefficient (R) of 0.776 and weighted average of 6.7%. Similarly, the statistical analysis conducted on geographies consisting of 162,263,235 people shows a poor positive correlation between the proportion of Immigrants from Saudi Arabia and unemployment rate among women with children under the age of 18 in the United States with a correlation coefficient (R) of 0.187 and weighted average of 5.4%, a difference of 24.1%.
Unemployment Among Women with Children Under 18 years Correlation Summary
| Measurement | U.S. Virgin Islander | Immigrants from Saudi Arabia |
| Minimum | 0.80% | 1.9% |
| Maximum | 100.0% | 82.4% |
| Range | 99.2% | 80.5% |
| Mean | 8.6% | 9.1% |
| Median | 6.7% | 5.5% |
| Interquartile 25% (IQ1) | 5.3% | 4.5% |
| Interquartile 75% (IQ3) | 8.2% | 6.5% |
| Interquartile Range (IQR) | 2.8% | 1.9% |
| Standard Deviation (Sample) | 12.3% | 15.9% |
| Standard Deviation (Population) | 12.2% | 15.6% |
Similar Demographics by Unemployment Among Women with Children Under 18 years
Demographics Similar to U.S. Virgin Islanders by Unemployment Among Women with Children Under 18 years
In terms of unemployment among women with children under 18 years, the demographic groups most similar to U.S. Virgin Islanders are Immigrants from Belize (6.7%, a difference of 0.050%), Central American Indian (6.7%, a difference of 0.14%), Alaska Native (6.7%, a difference of 0.39%), Shoshone (6.6%, a difference of 0.68%), and Immigrants from Ecuador (6.6%, a difference of 0.72%).
| Demographics | Rating | Rank | Unemployment Among Women with Children Under 18 years |
| British West Indians | 0.0 /100 | #314 | Tragic 6.6% |
| Immigrants | West Indies | 0.0 /100 | #315 | Tragic 6.6% |
| Immigrants | Ecuador | 0.0 /100 | #316 | Tragic 6.6% |
| Shoshone | 0.0 /100 | #317 | Tragic 6.6% |
| Alaska Natives | 0.0 /100 | #318 | Tragic 6.7% |
| Central American Indians | 0.0 /100 | #319 | Tragic 6.7% |
| Immigrants | Belize | 0.0 /100 | #320 | Tragic 6.7% |
| U.S. Virgin Islanders | 0.0 /100 | #321 | Tragic 6.7% |
| Houma | 0.0 /100 | #322 | Tragic 6.8% |
| Pueblo | 0.0 /100 | #323 | Tragic 6.8% |
| Paiute | 0.0 /100 | #324 | Tragic 6.9% |
| Immigrants | Dominica | 0.0 /100 | #325 | Tragic 7.0% |
| Chippewa | 0.0 /100 | #326 | Tragic 7.0% |
| Lumbee | 0.0 /100 | #327 | Tragic 7.1% |
| Natives/Alaskans | 0.0 /100 | #328 | Tragic 7.2% |
Demographics Similar to Immigrants from Saudi Arabia by Unemployment Among Women with Children Under 18 years
In terms of unemployment among women with children under 18 years, the demographic groups most similar to Immigrants from Saudi Arabia are Lebanese (5.4%, a difference of 0.030%), Immigrants from Iraq (5.4%, a difference of 0.070%), Afghan (5.4%, a difference of 0.12%), Celtic (5.4%, a difference of 0.16%), and Tlingit-Haida (5.4%, a difference of 0.24%).
| Demographics | Rating | Rank | Unemployment Among Women with Children Under 18 years |
| Koreans | 70.5 /100 | #155 | Good 5.4% |
| South Africans | 70.3 /100 | #156 | Good 5.4% |
| German Russians | 70.2 /100 | #157 | Good 5.4% |
| Immigrants | Burma/Myanmar | 69.5 /100 | #158 | Good 5.4% |
| Chickasaw | 68.4 /100 | #159 | Good 5.4% |
| Afghans | 66.6 /100 | #160 | Good 5.4% |
| Immigrants | Iraq | 65.9 /100 | #161 | Good 5.4% |
| Immigrants | Saudi Arabia | 65.0 /100 | #162 | Good 5.4% |
| Lebanese | 64.7 /100 | #163 | Good 5.4% |
| Celtics | 63.0 /100 | #164 | Good 5.4% |
| Tlingit-Haida | 61.9 /100 | #165 | Good 5.4% |
| Aleuts | 59.4 /100 | #166 | Average 5.4% |
| Immigrants | Denmark | 58.0 /100 | #167 | Average 5.4% |
| Immigrants | Northern Africa | 56.1 /100 | #168 | Average 5.4% |
| Immigrants | Thailand | 55.3 /100 | #169 | Average 5.4% |