Sierra Leonean vs Ghanaian Unemployment Among Ages 25 to 29 years
COMPARE
Sierra Leonean
Ghanaian
Unemployment Among Ages 25 to 29 years
Unemployment Among Ages 25 to 29 years Comparison
Sierra Leoneans
Ghanaians
7.2%
UNEMPLOYMENT AMONG AGES 25 TO 29 YEARS
0.4/ 100
METRIC RATING
252nd/ 347
METRIC RANK
7.2%
UNEMPLOYMENT AMONG AGES 25 TO 29 YEARS
0.3/ 100
METRIC RATING
254th/ 347
METRIC RANK
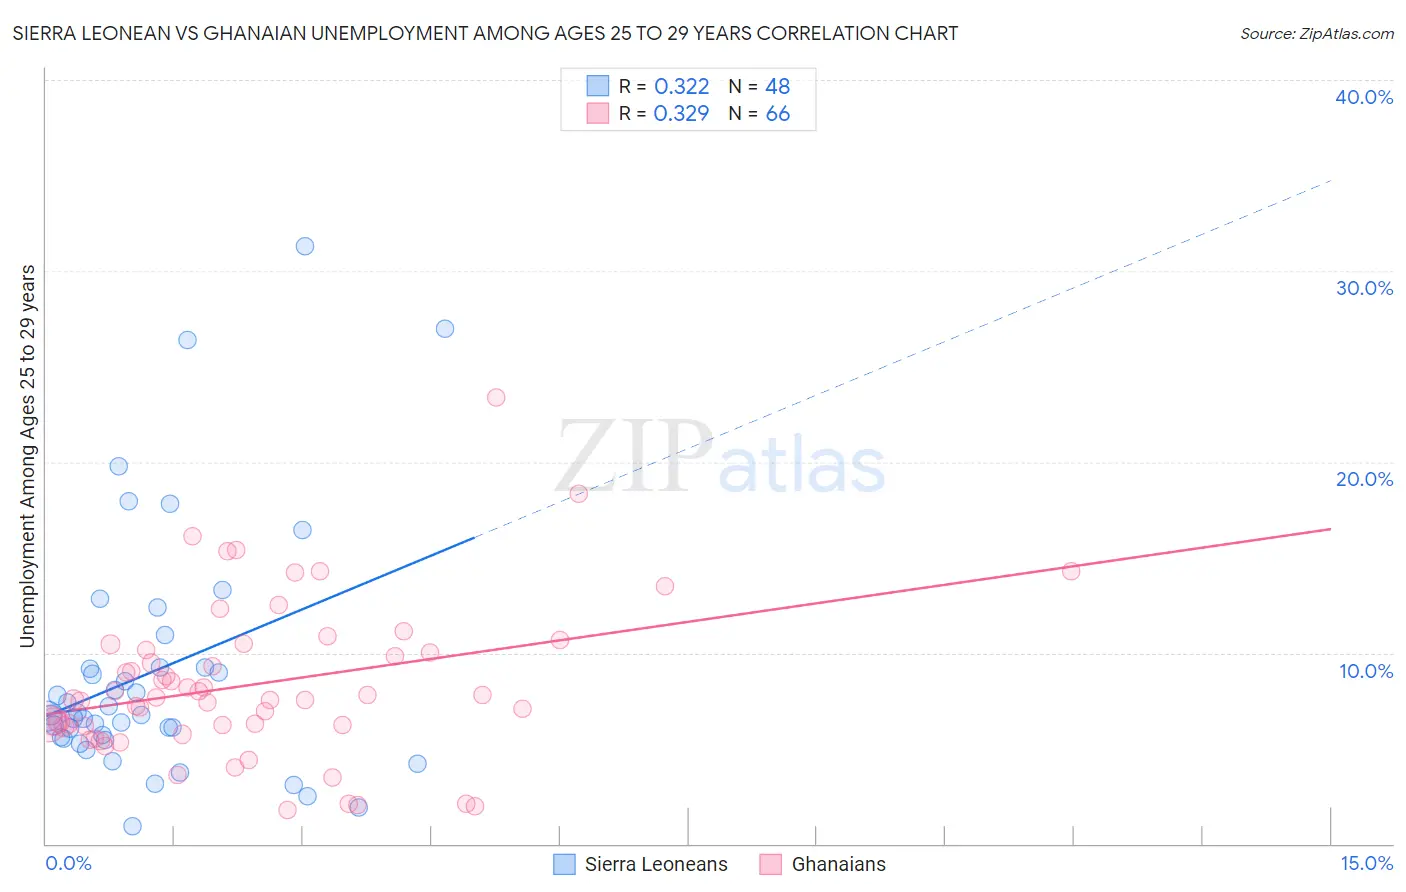
Sierra Leonean vs Ghanaian Unemployment Among Ages 25 to 29 years Correlation Chart
The statistical analysis conducted on geographies consisting of 82,809,978 people shows a mild positive correlation between the proportion of Sierra Leoneans and unemployment rate among population between the ages 25 and 29 in the United States with a correlation coefficient (R) of 0.322 and weighted average of 7.2%. Similarly, the statistical analysis conducted on geographies consisting of 187,167,021 people shows a mild positive correlation between the proportion of Ghanaians and unemployment rate among population between the ages 25 and 29 in the United States with a correlation coefficient (R) of 0.329 and weighted average of 7.2%, a difference of 0.47%.
Unemployment Among Ages 25 to 29 years Correlation Summary
| Measurement | Sierra Leonean | Ghanaian |
| Minimum | 0.95% | 1.8% |
| Maximum | 31.3% | 23.4% |
| Range | 30.4% | 21.6% |
| Mean | 9.0% | 8.4% |
| Median | 6.7% | 7.6% |
| Interquartile 25% (IQ1) | 5.5% | 6.2% |
| Interquartile 75% (IQ3) | 9.2% | 10.2% |
| Interquartile Range (IQR) | 3.7% | 4.0% |
| Standard Deviation (Sample) | 6.5% | 4.1% |
| Standard Deviation (Population) | 6.4% | 4.0% |
Demographics Similar to Sierra Leoneans and Ghanaians by Unemployment Among Ages 25 to 29 years
In terms of unemployment among ages 25 to 29 years, the demographic groups most similar to Sierra Leoneans are Portuguese (7.2%, a difference of 0.26%), Delaware (7.2%, a difference of 0.31%), Immigrants from Portugal (7.2%, a difference of 0.32%), Seminole (7.2%, a difference of 0.48%), and Subsaharan African (7.2%, a difference of 0.50%). Similarly, the demographic groups most similar to Ghanaians are Immigrants from Cameroon (7.2%, a difference of 0.060%), Immigrants from Portugal (7.2%, a difference of 0.15%), Mexican American Indian (7.3%, a difference of 0.26%), Assyrian/Chaldean/Syriac (7.3%, a difference of 0.63%), and Portuguese (7.2%, a difference of 0.73%).
| Demographics | Rating | Rank | Unemployment Among Ages 25 to 29 years |
| Yaqui | 1.0 /100 | #243 | Tragic 7.1% |
| Immigrants | Nonimmigrants | 0.9 /100 | #244 | Tragic 7.1% |
| Guatemalans | 0.9 /100 | #245 | Tragic 7.1% |
| Immigrants | Uzbekistan | 0.7 /100 | #246 | Tragic 7.2% |
| Immigrants | Guatemala | 0.7 /100 | #247 | Tragic 7.2% |
| Sub-Saharan Africans | 0.6 /100 | #248 | Tragic 7.2% |
| Seminole | 0.6 /100 | #249 | Tragic 7.2% |
| Delaware | 0.5 /100 | #250 | Tragic 7.2% |
| Portuguese | 0.5 /100 | #251 | Tragic 7.2% |
| Sierra Leoneans | 0.4 /100 | #252 | Tragic 7.2% |
| Immigrants | Portugal | 0.3 /100 | #253 | Tragic 7.2% |
| Ghanaians | 0.3 /100 | #254 | Tragic 7.2% |
| Immigrants | Cameroon | 0.3 /100 | #255 | Tragic 7.2% |
| Mexican American Indians | 0.3 /100 | #256 | Tragic 7.3% |
| Assyrians/Chaldeans/Syriacs | 0.2 /100 | #257 | Tragic 7.3% |
| Ottawa | 0.1 /100 | #258 | Tragic 7.3% |
| Cree | 0.1 /100 | #259 | Tragic 7.3% |
| Americans | 0.1 /100 | #260 | Tragic 7.4% |
| Nigerians | 0.1 /100 | #261 | Tragic 7.4% |
| Ecuadorians | 0.1 /100 | #262 | Tragic 7.4% |
| Kiowa | 0.1 /100 | #263 | Tragic 7.4% |