Dutch vs Ghanaian Family Households with Children
COMPARE
Dutch
Ghanaian
Family Households with Children
Family Households with Children Comparison
Dutch
Ghanaians
27.4%
FAMILY HOUSEHOLDS WITH CHILDREN
38.8/ 100
METRIC RATING
188th/ 347
METRIC RANK
28.5%
FAMILY HOUSEHOLDS WITH CHILDREN
99.9/ 100
METRIC RATING
67th/ 347
METRIC RANK
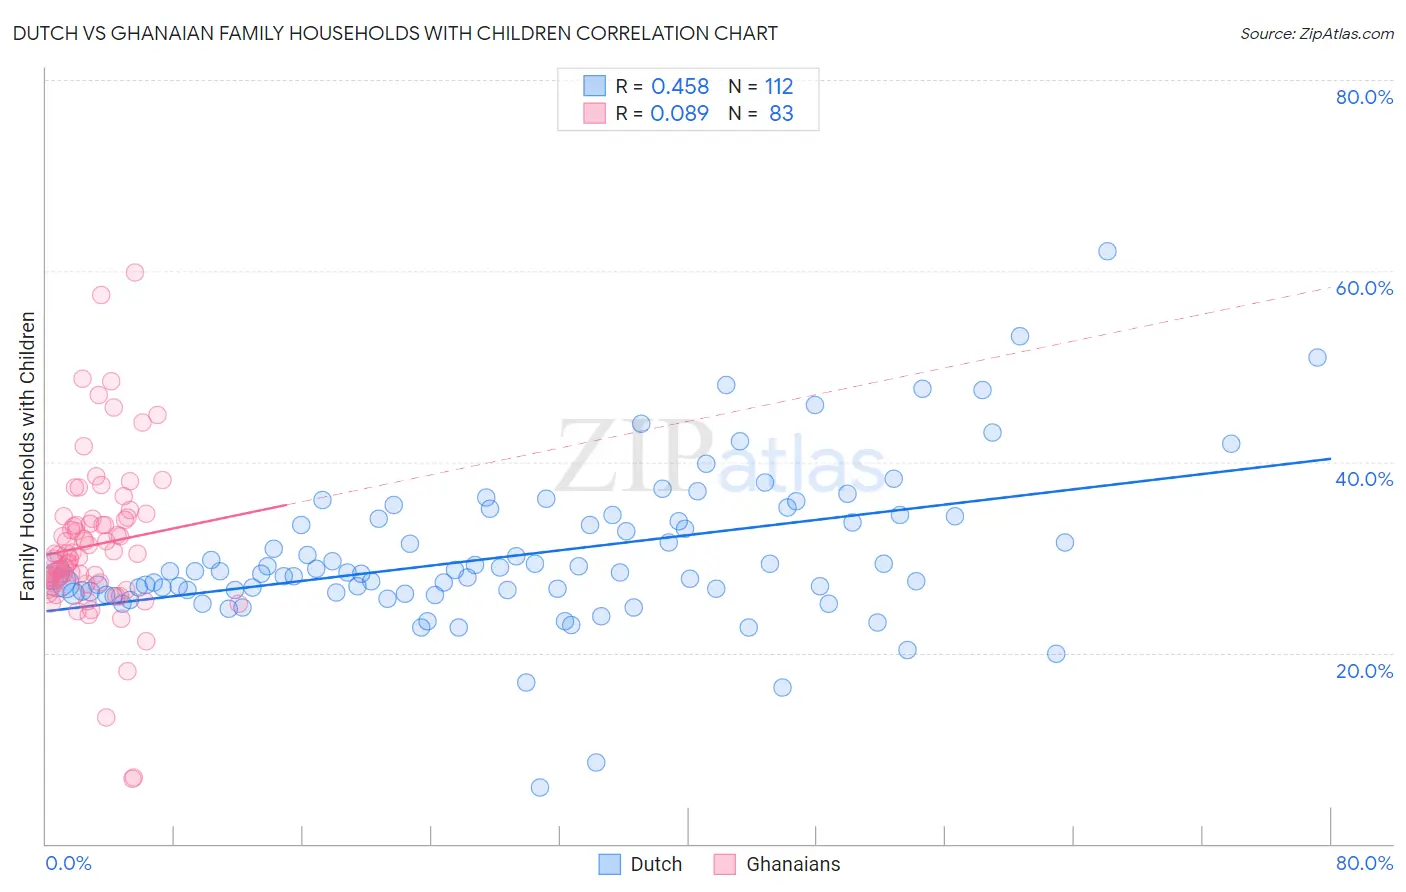
Dutch vs Ghanaian Family Households with Children Correlation Chart
The statistical analysis conducted on geographies consisting of 553,510,182 people shows a moderate positive correlation between the proportion of Dutch and percentage of family households with children in the United States with a correlation coefficient (R) of 0.458 and weighted average of 27.4%. Similarly, the statistical analysis conducted on geographies consisting of 190,475,172 people shows a slight positive correlation between the proportion of Ghanaians and percentage of family households with children in the United States with a correlation coefficient (R) of 0.089 and weighted average of 28.5%, a difference of 4.2%.
Family Households with Children Correlation Summary
| Measurement | Dutch | Ghanaian |
| Minimum | 5.9% | 6.8% |
| Maximum | 62.0% | 59.8% |
| Range | 56.1% | 53.0% |
| Mean | 30.2% | 31.3% |
| Median | 28.4% | 30.4% |
| Interquartile 25% (IQ1) | 26.4% | 27.3% |
| Interquartile 75% (IQ3) | 33.9% | 34.0% |
| Interquartile Range (IQR) | 7.6% | 6.7% |
| Standard Deviation (Sample) | 8.0% | 8.4% |
| Standard Deviation (Population) | 8.0% | 8.4% |
Similar Demographics by Family Households with Children
Demographics Similar to Dutch by Family Households with Children
In terms of family households with children, the demographic groups most similar to Dutch are Creek (27.4%, a difference of 0.020%), Immigrants from Israel (27.4%, a difference of 0.020%), Immigrants from Uruguay (27.4%, a difference of 0.030%), Sudanese (27.4%, a difference of 0.030%), and Pennsylvania German (27.4%, a difference of 0.030%).
| Demographics | Rating | Rank | Family Households with Children |
| Aleuts | 46.7 /100 | #181 | Average 27.4% |
| Puget Sound Salish | 46.2 /100 | #182 | Average 27.4% |
| South Africans | 44.9 /100 | #183 | Average 27.4% |
| Native Hawaiians | 44.6 /100 | #184 | Average 27.4% |
| Delaware | 42.0 /100 | #185 | Average 27.4% |
| Immigrants | Brazil | 40.6 /100 | #186 | Average 27.4% |
| Creek | 39.8 /100 | #187 | Fair 27.4% |
| Dutch | 38.8 /100 | #188 | Fair 27.4% |
| Immigrants | Israel | 37.9 /100 | #189 | Fair 27.4% |
| Immigrants | Uruguay | 37.7 /100 | #190 | Fair 27.4% |
| Sudanese | 37.6 /100 | #191 | Fair 27.4% |
| Pennsylvania Germans | 37.5 /100 | #192 | Fair 27.4% |
| Swedes | 36.9 /100 | #193 | Fair 27.4% |
| Immigrants | Iran | 36.1 /100 | #194 | Fair 27.4% |
| Crow | 35.7 /100 | #195 | Fair 27.4% |
Demographics Similar to Ghanaians by Family Households with Children
In terms of family households with children, the demographic groups most similar to Ghanaians are Immigrants from Egypt (28.5%, a difference of 0.0%), Honduran (28.5%, a difference of 0.010%), Houma (28.5%, a difference of 0.020%), Immigrants from Korea (28.5%, a difference of 0.040%), and Filipino (28.6%, a difference of 0.090%).
| Demographics | Rating | Rank | Family Households with Children |
| Hmong | 99.9 /100 | #60 | Exceptional 28.6% |
| Immigrants | Ghana | 99.9 /100 | #61 | Exceptional 28.6% |
| Egyptians | 99.9 /100 | #62 | Exceptional 28.6% |
| Immigrants | Lebanon | 99.9 /100 | #63 | Exceptional 28.6% |
| Filipinos | 99.9 /100 | #64 | Exceptional 28.6% |
| Hondurans | 99.9 /100 | #65 | Exceptional 28.5% |
| Immigrants | Egypt | 99.9 /100 | #66 | Exceptional 28.5% |
| Ghanaians | 99.9 /100 | #67 | Exceptional 28.5% |
| Houma | 99.9 /100 | #68 | Exceptional 28.5% |
| Immigrants | Korea | 99.9 /100 | #69 | Exceptional 28.5% |
| Immigrants | Honduras | 99.9 /100 | #70 | Exceptional 28.5% |
| Burmese | 99.9 /100 | #71 | Exceptional 28.5% |
| Immigrants | Indonesia | 99.9 /100 | #72 | Exceptional 28.5% |
| Iraqis | 99.9 /100 | #73 | Exceptional 28.5% |
| Laotians | 99.9 /100 | #74 | Exceptional 28.5% |