Australian vs Native/Alaskan Unemployment
COMPARE
Australian
Native/Alaskan
Unemployment
Unemployment Comparison
Australians
Natives/Alaskans
4.9%
UNEMPLOYMENT
99.2/ 100
METRIC RATING
55th/ 347
METRIC RANK
7.0%
UNEMPLOYMENT
0.0/ 100
METRIC RATING
325th/ 347
METRIC RANK
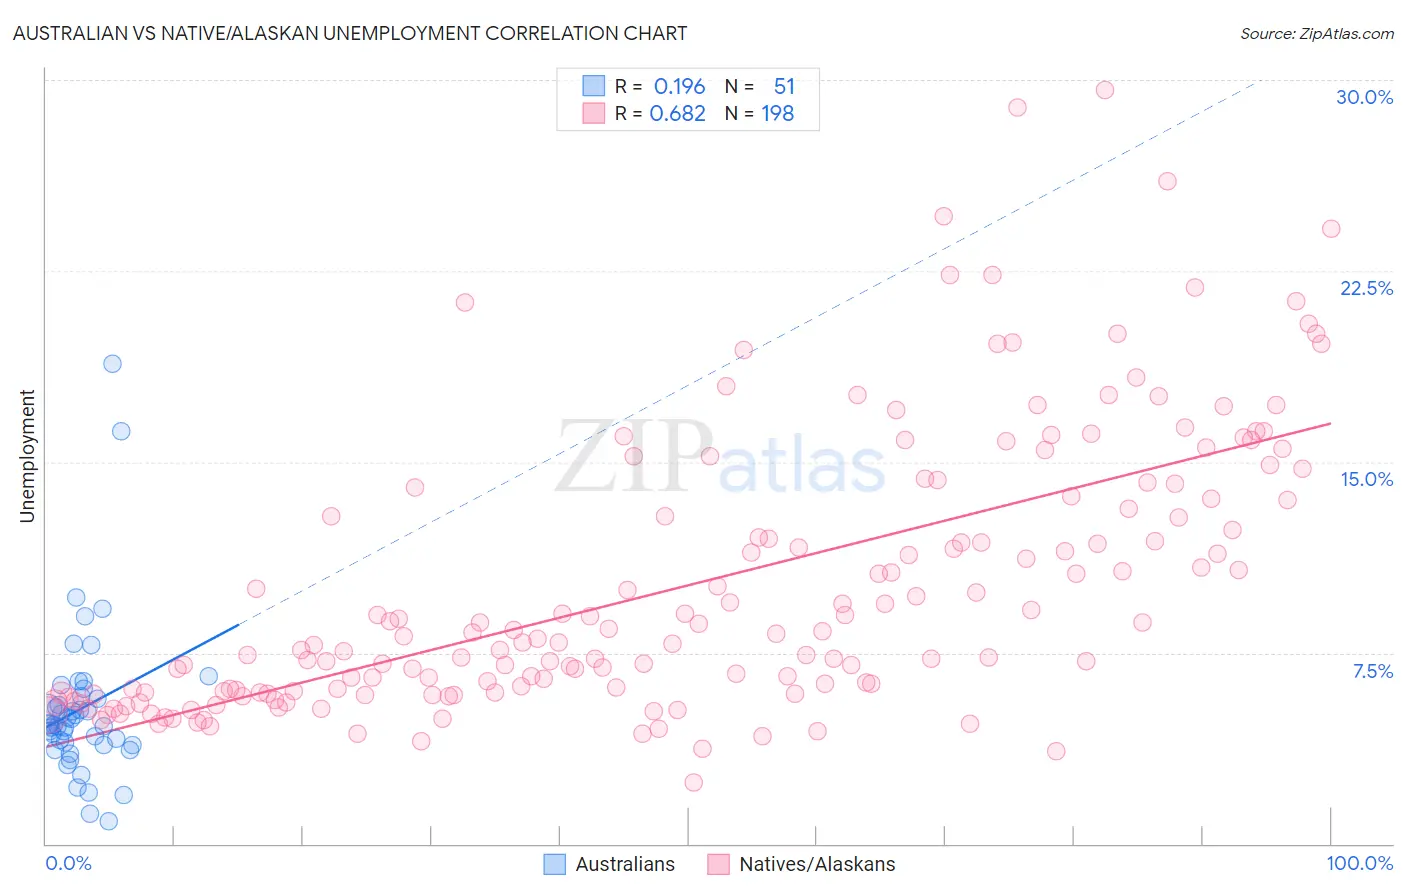
Australian vs Native/Alaskan Unemployment Correlation Chart
The statistical analysis conducted on geographies consisting of 224,052,970 people shows a poor positive correlation between the proportion of Australians and unemployment in the United States with a correlation coefficient (R) of 0.196 and weighted average of 4.9%. Similarly, the statistical analysis conducted on geographies consisting of 511,272,865 people shows a significant positive correlation between the proportion of Natives/Alaskans and unemployment in the United States with a correlation coefficient (R) of 0.682 and weighted average of 7.0%, a difference of 44.4%.
Unemployment Correlation Summary
| Measurement | Australian | Native/Alaskan |
| Minimum | 0.90% | 2.4% |
| Maximum | 18.9% | 29.6% |
| Range | 18.0% | 27.2% |
| Mean | 5.3% | 10.2% |
| Median | 4.7% | 8.2% |
| Interquartile 25% (IQ1) | 3.9% | 6.0% |
| Interquartile 75% (IQ3) | 5.8% | 13.5% |
| Interquartile Range (IQR) | 1.9% | 7.6% |
| Standard Deviation (Sample) | 3.1% | 5.4% |
| Standard Deviation (Population) | 3.1% | 5.4% |
Similar Demographics by Unemployment
Demographics Similar to Australians by Unemployment
In terms of unemployment, the demographic groups most similar to Australians are Eastern European (4.9%, a difference of 0.030%), Immigrants from Zimbabwe (4.9%, a difference of 0.060%), White/Caucasian (4.9%, a difference of 0.090%), Immigrants from Belgium (4.9%, a difference of 0.10%), and Celtic (4.9%, a difference of 0.16%).
| Demographics | Rating | Rank | Unemployment |
| Immigrants | Scotland | 99.3 /100 | #48 | Exceptional 4.9% |
| Immigrants | South Central Asia | 99.3 /100 | #49 | Exceptional 4.9% |
| French Canadians | 99.3 /100 | #50 | Exceptional 4.9% |
| Immigrants | Belgium | 99.2 /100 | #51 | Exceptional 4.9% |
| Whites/Caucasians | 99.2 /100 | #52 | Exceptional 4.9% |
| Immigrants | Zimbabwe | 99.2 /100 | #53 | Exceptional 4.9% |
| Eastern Europeans | 99.2 /100 | #54 | Exceptional 4.9% |
| Australians | 99.2 /100 | #55 | Exceptional 4.9% |
| Celtics | 99.1 /100 | #56 | Exceptional 4.9% |
| Immigrants | Singapore | 99.1 /100 | #57 | Exceptional 4.9% |
| Greeks | 99.0 /100 | #58 | Exceptional 4.9% |
| Bhutanese | 99.0 /100 | #59 | Exceptional 4.9% |
| Immigrants | Netherlands | 99.0 /100 | #60 | Exceptional 4.9% |
| Cambodians | 99.0 /100 | #61 | Exceptional 4.9% |
| Icelanders | 98.9 /100 | #62 | Exceptional 4.9% |
Demographics Similar to Natives/Alaskans by Unemployment
In terms of unemployment, the demographic groups most similar to Natives/Alaskans are Immigrants from Armenia (7.0%, a difference of 0.56%), Paiute (7.1%, a difference of 1.1%), Pueblo (7.2%, a difference of 1.7%), Immigrants from Grenada (6.9%, a difference of 1.7%), and Guyanese (6.9%, a difference of 2.1%).
| Demographics | Rating | Rank | Unemployment |
| Immigrants | Cabo Verde | 0.0 /100 | #318 | Tragic 6.8% |
| British West Indians | 0.0 /100 | #319 | Tragic 6.8% |
| Immigrants | St. Vincent and the Grenadines | 0.0 /100 | #320 | Tragic 6.9% |
| Immigrants | Guyana | 0.0 /100 | #321 | Tragic 6.9% |
| Guyanese | 0.0 /100 | #322 | Tragic 6.9% |
| Immigrants | Grenada | 0.0 /100 | #323 | Tragic 6.9% |
| Immigrants | Armenia | 0.0 /100 | #324 | Tragic 7.0% |
| Natives/Alaskans | 0.0 /100 | #325 | Tragic 7.0% |
| Paiute | 0.0 /100 | #326 | Tragic 7.1% |
| Pueblo | 0.0 /100 | #327 | Tragic 7.2% |
| Tsimshian | 0.0 /100 | #328 | Tragic 7.2% |
| Alaska Natives | 0.0 /100 | #329 | Tragic 7.2% |
| Yakama | 0.0 /100 | #330 | Tragic 7.3% |
| Dominicans | 0.0 /100 | #331 | Tragic 7.4% |
| Sioux | 0.0 /100 | #332 | Tragic 7.4% |