Delaware vs Shoshone Unemployment Among Women with Children Ages 6 to 17 years
COMPARE
Delaware
Shoshone
Unemployment Among Women with Children Ages 6 to 17 years
Unemployment Among Women with Children Ages 6 to 17 years Comparison
Delaware
Shoshone
10.5%
UNEMPLOYMENT AMONG WOMEN WITH CHILDREN AGES 6 TO 17 YEARS
0.0/ 100
METRIC RATING
318th/ 347
METRIC RANK
10.0%
UNEMPLOYMENT AMONG WOMEN WITH CHILDREN AGES 6 TO 17 YEARS
0.0/ 100
METRIC RATING
288th/ 347
METRIC RANK
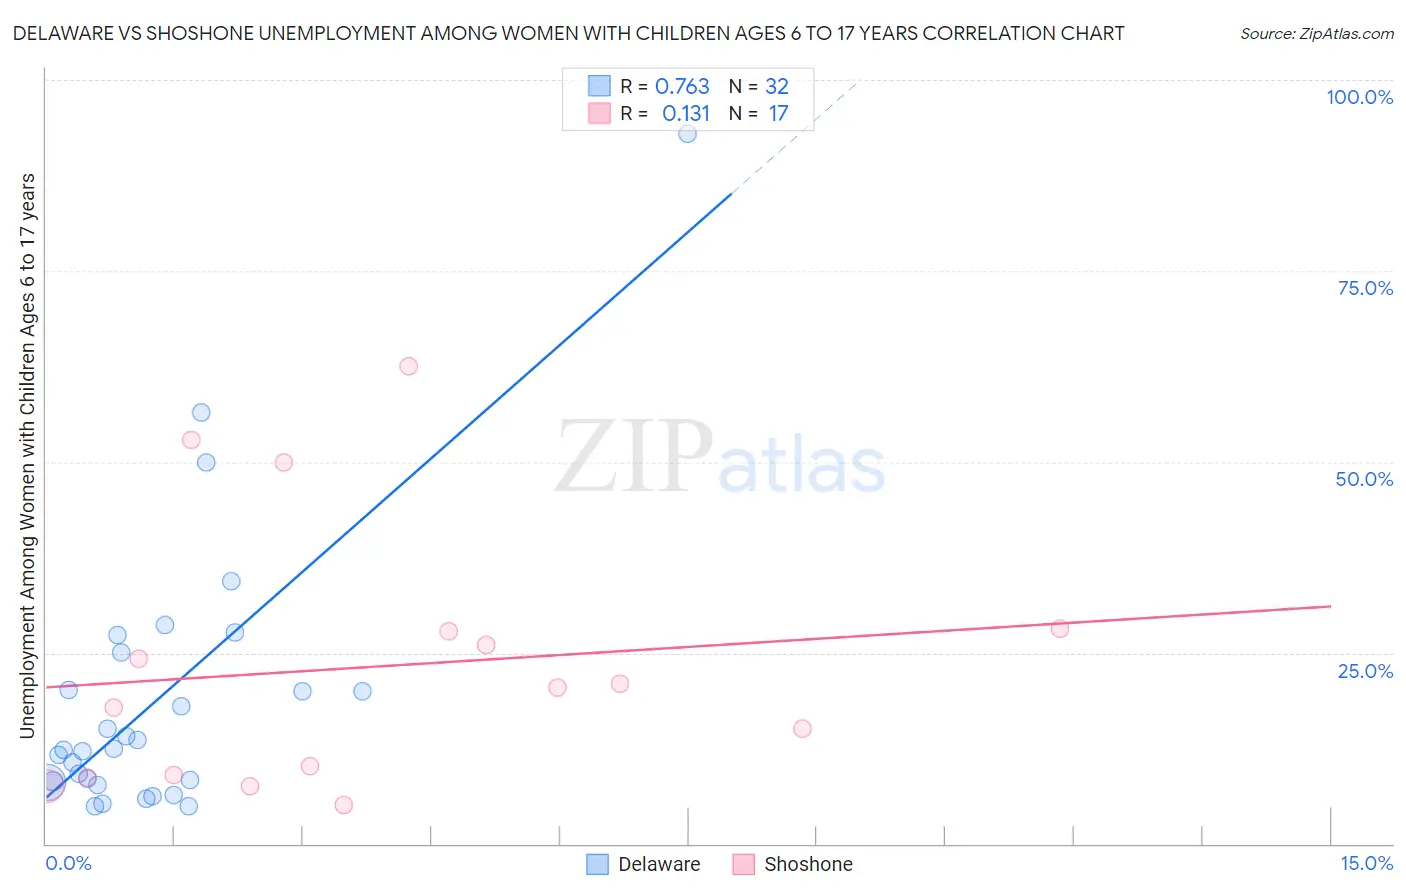
Delaware vs Shoshone Unemployment Among Women with Children Ages 6 to 17 years Correlation Chart
The statistical analysis conducted on geographies consisting of 82,551,003 people shows a strong positive correlation between the proportion of Delaware and unemployment rate among women with children between the ages 6 and 17 in the United States with a correlation coefficient (R) of 0.763 and weighted average of 10.5%. Similarly, the statistical analysis conducted on geographies consisting of 59,556,490 people shows a poor positive correlation between the proportion of Shoshone and unemployment rate among women with children between the ages 6 and 17 in the United States with a correlation coefficient (R) of 0.131 and weighted average of 10.0%, a difference of 5.6%.
Unemployment Among Women with Children Ages 6 to 17 years Correlation Summary
| Measurement | Delaware | Shoshone |
| Minimum | 4.9% | 5.0% |
| Maximum | 93.0% | 62.5% |
| Range | 88.1% | 57.5% |
| Mean | 18.9% | 23.2% |
| Median | 12.4% | 20.4% |
| Interquartile 25% (IQ1) | 8.1% | 8.8% |
| Interquartile 75% (IQ3) | 22.6% | 28.1% |
| Interquartile Range (IQR) | 14.5% | 19.2% |
| Standard Deviation (Sample) | 18.4% | 17.2% |
| Standard Deviation (Population) | 18.1% | 16.6% |
Similar Demographics by Unemployment Among Women with Children Ages 6 to 17 years
Demographics Similar to Delaware by Unemployment Among Women with Children Ages 6 to 17 years
In terms of unemployment among women with children ages 6 to 17 years, the demographic groups most similar to Delaware are Bermudan (10.5%, a difference of 0.020%), Immigrants from Dominica (10.5%, a difference of 0.13%), Bahamian (10.4%, a difference of 0.88%), Immigrants from Cabo Verde (10.4%, a difference of 0.91%), and American (10.4%, a difference of 0.96%).
| Demographics | Rating | Rank | Unemployment Among Women with Children Ages 6 to 17 years |
| Immigrants | Liberia | 0.0 /100 | #311 | Tragic 10.3% |
| Africans | 0.0 /100 | #312 | Tragic 10.4% |
| Americans | 0.0 /100 | #313 | Tragic 10.4% |
| Immigrants | Cabo Verde | 0.0 /100 | #314 | Tragic 10.4% |
| Bahamians | 0.0 /100 | #315 | Tragic 10.4% |
| Immigrants | Dominica | 0.0 /100 | #316 | Tragic 10.5% |
| Bermudans | 0.0 /100 | #317 | Tragic 10.5% |
| Delaware | 0.0 /100 | #318 | Tragic 10.5% |
| Immigrants | Uganda | 0.0 /100 | #319 | Tragic 10.7% |
| Apache | 0.0 /100 | #320 | Tragic 10.7% |
| Tohono O'odham | 0.0 /100 | #321 | Tragic 10.7% |
| Cree | 0.0 /100 | #322 | Tragic 10.8% |
| Dominicans | 0.0 /100 | #323 | Tragic 10.8% |
| Immigrants | Dominican Republic | 0.0 /100 | #324 | Tragic 10.8% |
| Cajuns | 0.0 /100 | #325 | Tragic 10.8% |
Demographics Similar to Shoshone by Unemployment Among Women with Children Ages 6 to 17 years
In terms of unemployment among women with children ages 6 to 17 years, the demographic groups most similar to Shoshone are Sierra Leonean (9.9%, a difference of 0.24%), Choctaw (9.9%, a difference of 0.29%), Hispanic or Latino (9.9%, a difference of 0.41%), Honduran (10.0%, a difference of 0.43%), and Subsaharan African (10.0%, a difference of 0.44%).
| Demographics | Rating | Rank | Unemployment Among Women with Children Ages 6 to 17 years |
| Jamaicans | 0.0 /100 | #281 | Tragic 9.8% |
| Slovaks | 0.0 /100 | #282 | Tragic 9.8% |
| Central American Indians | 0.0 /100 | #283 | Tragic 9.9% |
| Yakama | 0.0 /100 | #284 | Tragic 9.9% |
| Hispanics or Latinos | 0.0 /100 | #285 | Tragic 9.9% |
| Choctaw | 0.0 /100 | #286 | Tragic 9.9% |
| Sierra Leoneans | 0.0 /100 | #287 | Tragic 9.9% |
| Shoshone | 0.0 /100 | #288 | Tragic 10.0% |
| Hondurans | 0.0 /100 | #289 | Tragic 10.0% |
| Sub-Saharan Africans | 0.0 /100 | #290 | Tragic 10.0% |
| Immigrants | Nonimmigrants | 0.0 /100 | #291 | Tragic 10.0% |
| Carpatho Rusyns | 0.0 /100 | #292 | Tragic 10.0% |
| Haitians | 0.0 /100 | #293 | Tragic 10.0% |
| Ecuadorians | 0.0 /100 | #294 | Tragic 10.0% |
| Cherokee | 0.0 /100 | #295 | Tragic 10.0% |