Delaware vs Immigrants from Sri Lanka Unemployment Among Women with Children Ages 6 to 17 years
COMPARE
Delaware
Immigrants from Sri Lanka
Unemployment Among Women with Children Ages 6 to 17 years
Unemployment Among Women with Children Ages 6 to 17 years Comparison
Delaware
Immigrants from Sri Lanka
10.5%
UNEMPLOYMENT AMONG WOMEN WITH CHILDREN AGES 6 TO 17 YEARS
0.0/ 100
METRIC RATING
318th/ 347
METRIC RANK
8.4%
UNEMPLOYMENT AMONG WOMEN WITH CHILDREN AGES 6 TO 17 YEARS
99.7/ 100
METRIC RATING
75th/ 347
METRIC RANK
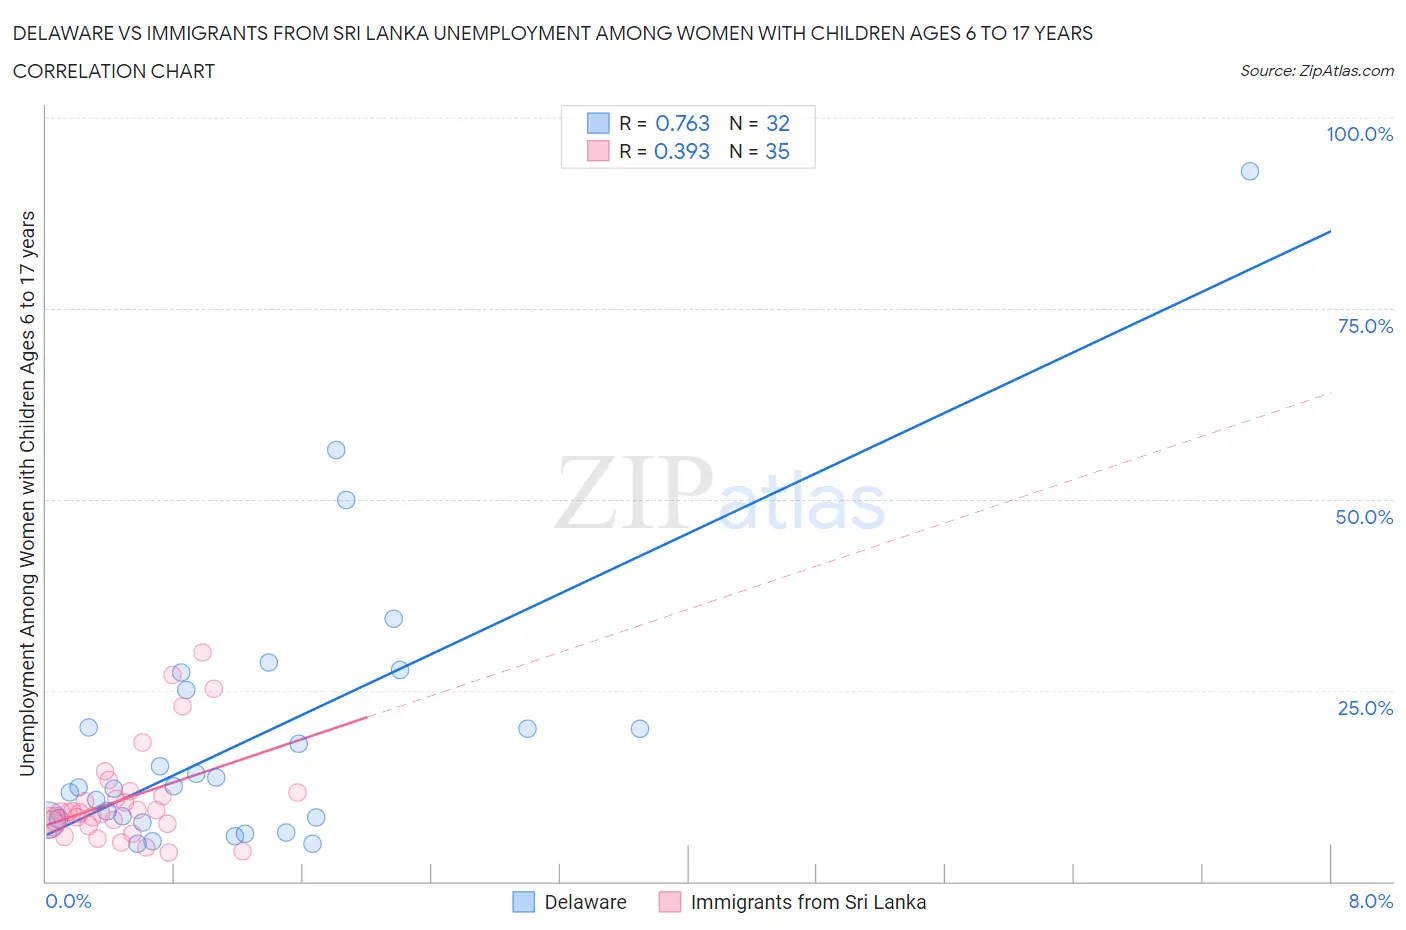
Delaware vs Immigrants from Sri Lanka Unemployment Among Women with Children Ages 6 to 17 years Correlation Chart
The statistical analysis conducted on geographies consisting of 82,551,003 people shows a strong positive correlation between the proportion of Delaware and unemployment rate among women with children between the ages 6 and 17 in the United States with a correlation coefficient (R) of 0.763 and weighted average of 10.5%. Similarly, the statistical analysis conducted on geographies consisting of 125,381,716 people shows a mild positive correlation between the proportion of Immigrants from Sri Lanka and unemployment rate among women with children between the ages 6 and 17 in the United States with a correlation coefficient (R) of 0.393 and weighted average of 8.4%, a difference of 25.3%.
Unemployment Among Women with Children Ages 6 to 17 years Correlation Summary
| Measurement | Delaware | Immigrants from Sri Lanka |
| Minimum | 4.9% | 3.8% |
| Maximum | 93.0% | 29.9% |
| Range | 88.1% | 26.1% |
| Mean | 18.9% | 10.8% |
| Median | 12.4% | 9.0% |
| Interquartile 25% (IQ1) | 8.1% | 7.5% |
| Interquartile 75% (IQ3) | 22.6% | 11.6% |
| Interquartile Range (IQR) | 14.5% | 4.1% |
| Standard Deviation (Sample) | 18.4% | 6.4% |
| Standard Deviation (Population) | 18.1% | 6.3% |
Similar Demographics by Unemployment Among Women with Children Ages 6 to 17 years
Demographics Similar to Delaware by Unemployment Among Women with Children Ages 6 to 17 years
In terms of unemployment among women with children ages 6 to 17 years, the demographic groups most similar to Delaware are Bermudan (10.5%, a difference of 0.020%), Immigrants from Dominica (10.5%, a difference of 0.13%), Bahamian (10.4%, a difference of 0.88%), Immigrants from Cabo Verde (10.4%, a difference of 0.91%), and American (10.4%, a difference of 0.96%).
| Demographics | Rating | Rank | Unemployment Among Women with Children Ages 6 to 17 years |
| Immigrants | Liberia | 0.0 /100 | #311 | Tragic 10.3% |
| Africans | 0.0 /100 | #312 | Tragic 10.4% |
| Americans | 0.0 /100 | #313 | Tragic 10.4% |
| Immigrants | Cabo Verde | 0.0 /100 | #314 | Tragic 10.4% |
| Bahamians | 0.0 /100 | #315 | Tragic 10.4% |
| Immigrants | Dominica | 0.0 /100 | #316 | Tragic 10.5% |
| Bermudans | 0.0 /100 | #317 | Tragic 10.5% |
| Delaware | 0.0 /100 | #318 | Tragic 10.5% |
| Immigrants | Uganda | 0.0 /100 | #319 | Tragic 10.7% |
| Apache | 0.0 /100 | #320 | Tragic 10.7% |
| Tohono O'odham | 0.0 /100 | #321 | Tragic 10.7% |
| Cree | 0.0 /100 | #322 | Tragic 10.8% |
| Dominicans | 0.0 /100 | #323 | Tragic 10.8% |
| Immigrants | Dominican Republic | 0.0 /100 | #324 | Tragic 10.8% |
| Cajuns | 0.0 /100 | #325 | Tragic 10.8% |
Demographics Similar to Immigrants from Sri Lanka by Unemployment Among Women with Children Ages 6 to 17 years
In terms of unemployment among women with children ages 6 to 17 years, the demographic groups most similar to Immigrants from Sri Lanka are Immigrants from Moldova (8.4%, a difference of 0.020%), Samoan (8.4%, a difference of 0.080%), Iraqi (8.4%, a difference of 0.080%), Pakistani (8.4%, a difference of 0.21%), and Mongolian (8.4%, a difference of 0.22%).
| Demographics | Rating | Rank | Unemployment Among Women with Children Ages 6 to 17 years |
| Marshallese | 99.9 /100 | #68 | Exceptional 8.3% |
| Immigrants | Thailand | 99.9 /100 | #69 | Exceptional 8.3% |
| Norwegians | 99.9 /100 | #70 | Exceptional 8.3% |
| Immigrants | Australia | 99.8 /100 | #71 | Exceptional 8.3% |
| Immigrants | Nepal | 99.8 /100 | #72 | Exceptional 8.3% |
| Spanish Americans | 99.8 /100 | #73 | Exceptional 8.4% |
| Samoans | 99.7 /100 | #74 | Exceptional 8.4% |
| Immigrants | Sri Lanka | 99.7 /100 | #75 | Exceptional 8.4% |
| Immigrants | Moldova | 99.7 /100 | #76 | Exceptional 8.4% |
| Iraqis | 99.7 /100 | #77 | Exceptional 8.4% |
| Pakistanis | 99.6 /100 | #78 | Exceptional 8.4% |
| Mongolians | 99.6 /100 | #79 | Exceptional 8.4% |
| Immigrants | Belarus | 99.6 /100 | #80 | Exceptional 8.4% |
| Immigrants | Bolivia | 99.6 /100 | #81 | Exceptional 8.4% |
| Cypriots | 99.6 /100 | #82 | Exceptional 8.4% |