Czech vs Immigrants from Hong Kong Unemployment Among Ages 16 to 19 years
COMPARE
Czech
Immigrants from Hong Kong
Unemployment Among Ages 16 to 19 years
Unemployment Among Ages 16 to 19 years Comparison
Czechs
Immigrants from Hong Kong
15.4%
UNEMPLOYMENT AMONG AGES 16 TO 19 YEARS
100.0/ 100
METRIC RATING
8th/ 347
METRIC RANK
17.4%
UNEMPLOYMENT AMONG AGES 16 TO 19 YEARS
69.3/ 100
METRIC RATING
151st/ 347
METRIC RANK
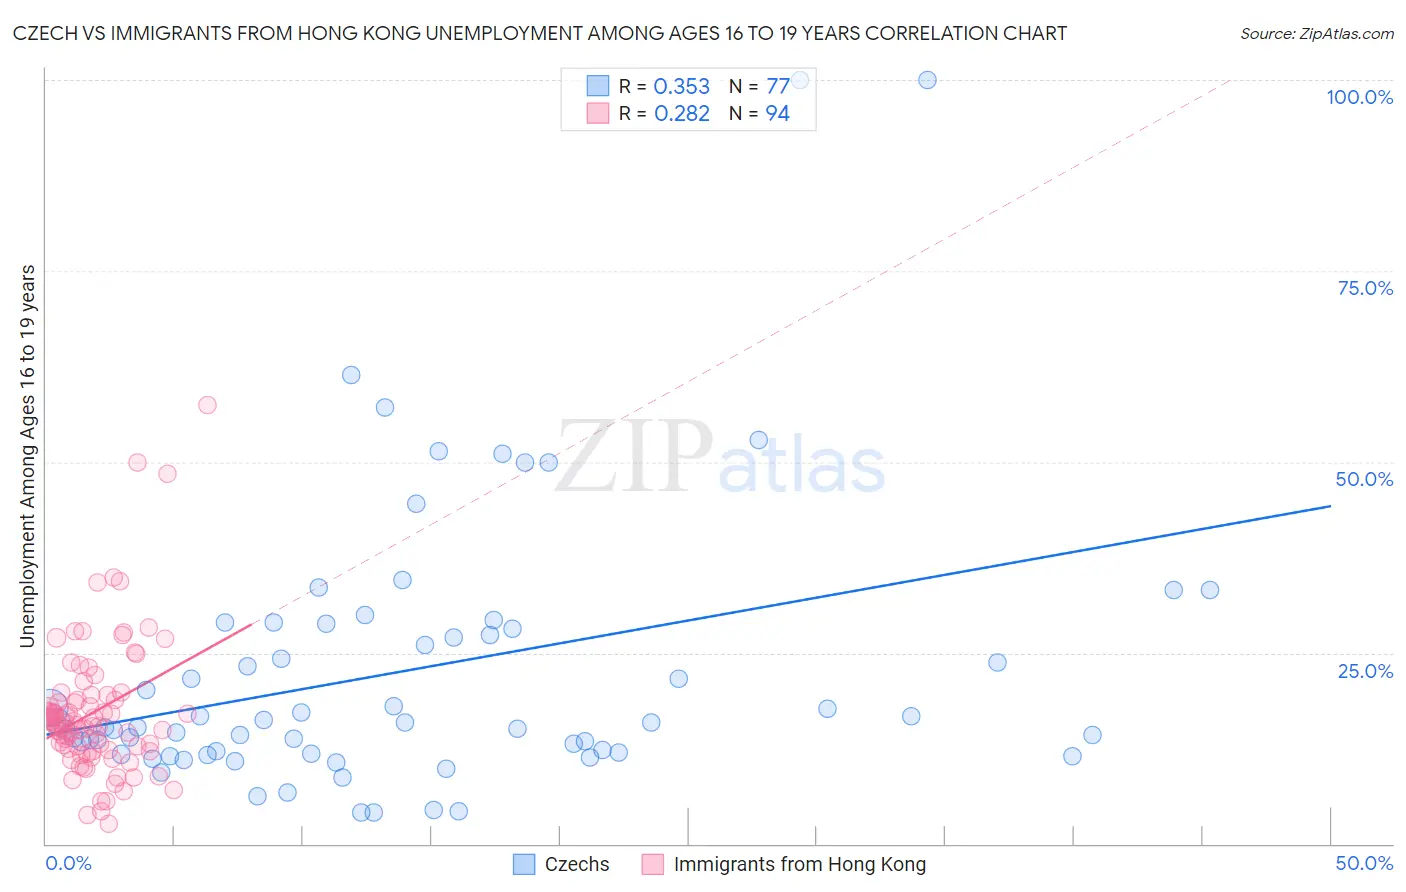
Czech vs Immigrants from Hong Kong Unemployment Among Ages 16 to 19 years Correlation Chart
The statistical analysis conducted on geographies consisting of 445,681,187 people shows a mild positive correlation between the proportion of Czechs and unemployment rate among population between the ages 16 and 19 in the United States with a correlation coefficient (R) of 0.353 and weighted average of 15.4%. Similarly, the statistical analysis conducted on geographies consisting of 245,096,647 people shows a weak positive correlation between the proportion of Immigrants from Hong Kong and unemployment rate among population between the ages 16 and 19 in the United States with a correlation coefficient (R) of 0.282 and weighted average of 17.4%, a difference of 13.2%.
Unemployment Among Ages 16 to 19 years Correlation Summary
| Measurement | Czech | Immigrants from Hong Kong |
| Minimum | 4.0% | 2.7% |
| Maximum | 100.0% | 57.4% |
| Range | 96.0% | 54.7% |
| Mean | 22.7% | 17.3% |
| Median | 15.9% | 15.8% |
| Interquartile 25% (IQ1) | 11.8% | 12.2% |
| Interquartile 75% (IQ3) | 28.5% | 19.4% |
| Interquartile Range (IQR) | 16.7% | 7.2% |
| Standard Deviation (Sample) | 18.3% | 9.1% |
| Standard Deviation (Population) | 18.2% | 9.1% |
Similar Demographics by Unemployment Among Ages 16 to 19 years
Demographics Similar to Czechs by Unemployment Among Ages 16 to 19 years
In terms of unemployment among ages 16 to 19 years, the demographic groups most similar to Czechs are Immigrants from Bosnia and Herzegovina (15.3%, a difference of 0.24%), Scandinavian (15.4%, a difference of 0.33%), Swedish (15.3%, a difference of 0.41%), Zimbabwean (15.4%, a difference of 0.44%), and Immigrants from Somalia (15.3%, a difference of 0.68%).
| Demographics | Rating | Rank | Unemployment Among Ages 16 to 19 years |
| Norwegians | 100.0 /100 | #1 | Exceptional 14.5% |
| Immigrants | India | 100.0 /100 | #2 | Exceptional 15.0% |
| Luxembourgers | 100.0 /100 | #3 | Exceptional 15.1% |
| Danes | 100.0 /100 | #4 | Exceptional 15.2% |
| Immigrants | Somalia | 100.0 /100 | #5 | Exceptional 15.3% |
| Swedes | 100.0 /100 | #6 | Exceptional 15.3% |
| Immigrants | Bosnia and Herzegovina | 100.0 /100 | #7 | Exceptional 15.3% |
| Czechs | 100.0 /100 | #8 | Exceptional 15.4% |
| Scandinavians | 100.0 /100 | #9 | Exceptional 15.4% |
| Zimbabweans | 100.0 /100 | #10 | Exceptional 15.4% |
| Indonesians | 100.0 /100 | #11 | Exceptional 15.5% |
| Taiwanese | 100.0 /100 | #12 | Exceptional 15.5% |
| Immigrants | Burma/Myanmar | 100.0 /100 | #13 | Exceptional 15.6% |
| Immigrants | Zaire | 100.0 /100 | #14 | Exceptional 15.6% |
| Yugoslavians | 100.0 /100 | #15 | Exceptional 15.6% |
Demographics Similar to Immigrants from Hong Kong by Unemployment Among Ages 16 to 19 years
In terms of unemployment among ages 16 to 19 years, the demographic groups most similar to Immigrants from Hong Kong are Immigrants from Northern Africa (17.4%, a difference of 0.020%), Immigrants from Afghanistan (17.4%, a difference of 0.040%), Afghan (17.4%, a difference of 0.060%), Portuguese (17.4%, a difference of 0.11%), and Costa Rican (17.4%, a difference of 0.18%).
| Demographics | Rating | Rank | Unemployment Among Ages 16 to 19 years |
| Immigrants | England | 78.9 /100 | #144 | Good 17.3% |
| Indians (Asian) | 77.6 /100 | #145 | Good 17.3% |
| Turks | 77.1 /100 | #146 | Good 17.3% |
| Tsimshian | 76.0 /100 | #147 | Good 17.3% |
| Romanians | 74.9 /100 | #148 | Good 17.3% |
| Immigrants | Eastern Asia | 73.8 /100 | #149 | Good 17.4% |
| Immigrants | Northern Europe | 72.5 /100 | #150 | Good 17.4% |
| Immigrants | Hong Kong | 69.3 /100 | #151 | Good 17.4% |
| Immigrants | Northern Africa | 69.0 /100 | #152 | Good 17.4% |
| Immigrants | Afghanistan | 68.6 /100 | #153 | Good 17.4% |
| Afghans | 68.1 /100 | #154 | Good 17.4% |
| Portuguese | 67.3 /100 | #155 | Good 17.4% |
| Costa Ricans | 65.9 /100 | #156 | Good 17.4% |
| Uruguayans | 64.3 /100 | #157 | Good 17.5% |
| Immigrants | China | 64.1 /100 | #158 | Good 17.5% |