Central American Indian vs Chippewa Unemployment Among Ages 16 to 19 years
COMPARE
Central American Indian
Chippewa
Unemployment Among Ages 16 to 19 years
Unemployment Among Ages 16 to 19 years Comparison
Central American Indians
Chippewa
20.4%
UNEMPLOYMENT AMONG AGES 16 TO 19 YEARS
0.0/ 100
METRIC RATING
295th/ 347
METRIC RANK
18.0%
UNEMPLOYMENT AMONG AGES 16 TO 19 YEARS
13.7/ 100
METRIC RATING
213th/ 347
METRIC RANK
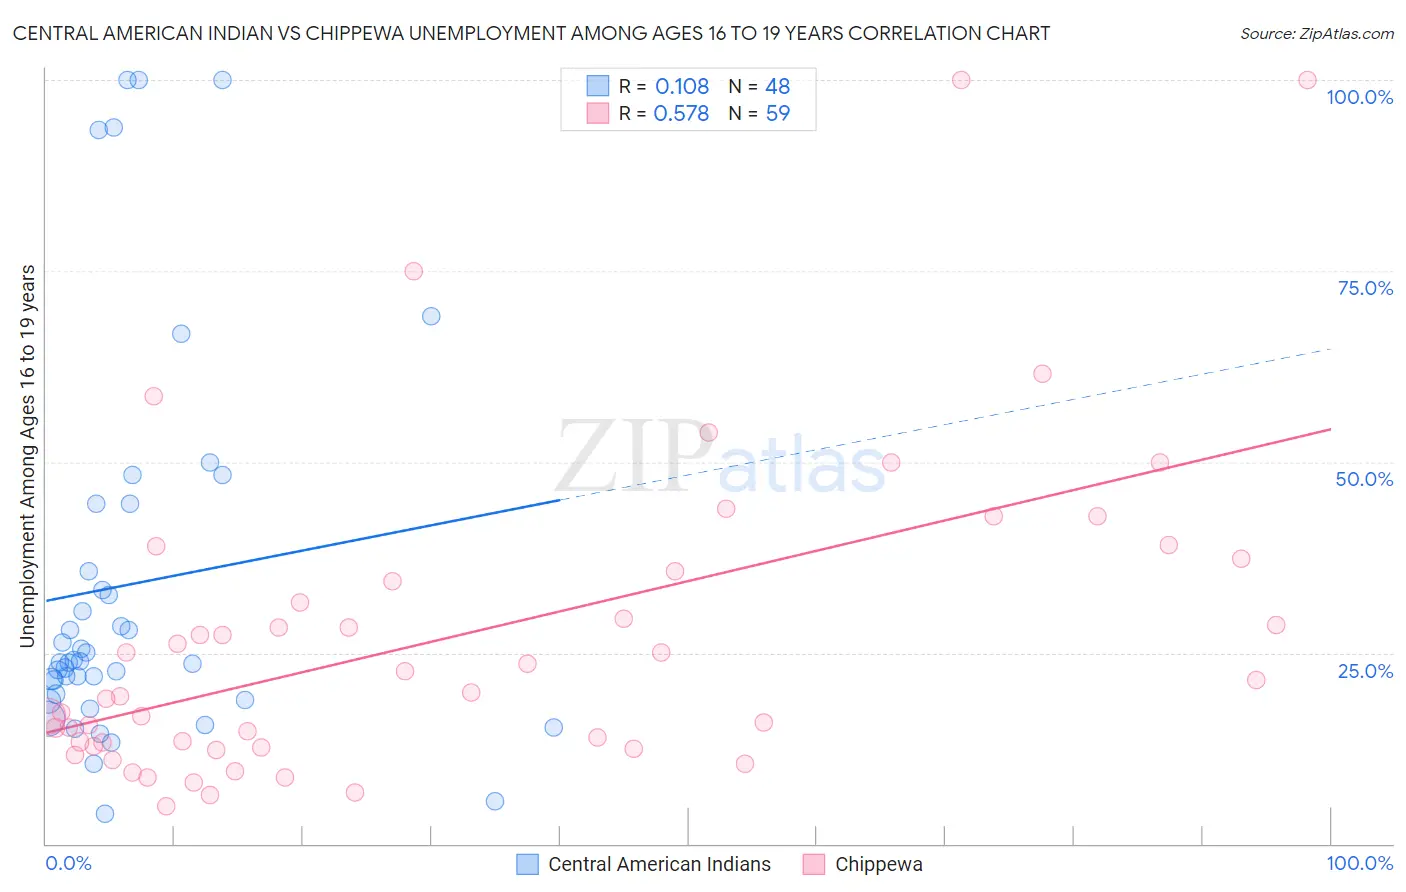
Central American Indian vs Chippewa Unemployment Among Ages 16 to 19 years Correlation Chart
The statistical analysis conducted on geographies consisting of 315,473,467 people shows a poor positive correlation between the proportion of Central American Indians and unemployment rate among population between the ages 16 and 19 in the United States with a correlation coefficient (R) of 0.108 and weighted average of 20.4%. Similarly, the statistical analysis conducted on geographies consisting of 207,549,693 people shows a substantial positive correlation between the proportion of Chippewa and unemployment rate among population between the ages 16 and 19 in the United States with a correlation coefficient (R) of 0.578 and weighted average of 18.0%, a difference of 13.8%.
Unemployment Among Ages 16 to 19 years Correlation Summary
| Measurement | Central American Indian | Chippewa |
| Minimum | 3.9% | 4.9% |
| Maximum | 100.0% | 100.0% |
| Range | 96.1% | 95.1% |
| Mean | 34.0% | 27.0% |
| Median | 23.8% | 19.7% |
| Interquartile 25% (IQ1) | 19.2% | 12.7% |
| Interquartile 75% (IQ3) | 40.1% | 35.6% |
| Interquartile Range (IQR) | 20.9% | 22.9% |
| Standard Deviation (Sample) | 25.6% | 20.7% |
| Standard Deviation (Population) | 25.3% | 20.5% |
Similar Demographics by Unemployment Among Ages 16 to 19 years
Demographics Similar to Central American Indians by Unemployment Among Ages 16 to 19 years
In terms of unemployment among ages 16 to 19 years, the demographic groups most similar to Central American Indians are Immigrants from Haiti (20.4%, a difference of 0.060%), Armenian (20.5%, a difference of 0.29%), Immigrants from Bahamas (20.4%, a difference of 0.32%), Alsatian (20.5%, a difference of 0.32%), and Haitian (20.5%, a difference of 0.38%).
| Demographics | Rating | Rank | Unemployment Among Ages 16 to 19 years |
| Immigrants | Azores | 0.0 /100 | #288 | Tragic 19.8% |
| Pueblo | 0.0 /100 | #289 | Tragic 19.8% |
| Immigrants | Sierra Leone | 0.0 /100 | #290 | Tragic 20.0% |
| Immigrants | Yemen | 0.0 /100 | #291 | Tragic 20.0% |
| Comanche | 0.0 /100 | #292 | Tragic 20.2% |
| Immigrants | Bahamas | 0.0 /100 | #293 | Tragic 20.4% |
| Immigrants | Haiti | 0.0 /100 | #294 | Tragic 20.4% |
| Central American Indians | 0.0 /100 | #295 | Tragic 20.4% |
| Armenians | 0.0 /100 | #296 | Tragic 20.5% |
| Alsatians | 0.0 /100 | #297 | Tragic 20.5% |
| Haitians | 0.0 /100 | #298 | Tragic 20.5% |
| Immigrants | Uzbekistan | 0.0 /100 | #299 | Tragic 20.5% |
| Ecuadorians | 0.0 /100 | #300 | Tragic 20.5% |
| Immigrants | Ecuador | 0.0 /100 | #301 | Tragic 20.9% |
| Immigrants | Caribbean | 0.0 /100 | #302 | Tragic 20.9% |
Demographics Similar to Chippewa by Unemployment Among Ages 16 to 19 years
In terms of unemployment among ages 16 to 19 years, the demographic groups most similar to Chippewa are Argentinean (18.0%, a difference of 0.010%), Immigrants from Morocco (18.0%, a difference of 0.020%), Immigrants from Syria (18.0%, a difference of 0.040%), Guamanian/Chamorro (17.9%, a difference of 0.070%), and Immigrants from Kazakhstan (18.0%, a difference of 0.080%).
| Demographics | Rating | Rank | Unemployment Among Ages 16 to 19 years |
| Immigrants | Southern Europe | 18.9 /100 | #206 | Poor 17.9% |
| Liberians | 18.6 /100 | #207 | Poor 17.9% |
| Hawaiians | 16.8 /100 | #208 | Poor 17.9% |
| Cherokee | 15.7 /100 | #209 | Poor 17.9% |
| Carpatho Rusyns | 15.6 /100 | #210 | Poor 17.9% |
| Guamanians/Chamorros | 14.5 /100 | #211 | Poor 17.9% |
| Argentineans | 13.8 /100 | #212 | Poor 18.0% |
| Chippewa | 13.7 /100 | #213 | Poor 18.0% |
| Immigrants | Morocco | 13.5 /100 | #214 | Poor 18.0% |
| Immigrants | Syria | 13.3 /100 | #215 | Poor 18.0% |
| Immigrants | Kazakhstan | 13.0 /100 | #216 | Poor 18.0% |
| South American Indians | 13.0 /100 | #217 | Poor 18.0% |
| Immigrants | Argentina | 12.5 /100 | #218 | Poor 18.0% |
| Immigrants | Africa | 12.0 /100 | #219 | Poor 18.0% |
| Immigrants | Albania | 11.4 /100 | #220 | Poor 18.0% |