Cypriot vs Ute Unemployment Among Ages 30 to 34 years
COMPARE
Cypriot
Ute
Unemployment Among Ages 30 to 34 years
Unemployment Among Ages 30 to 34 years Comparison
Cypriots
Ute
5.1%
UNEMPLOYMENT AMONG AGES 30 TO 34 YEARS
98.4/ 100
METRIC RATING
47th/ 347
METRIC RANK
7.0%
UNEMPLOYMENT AMONG AGES 30 TO 34 YEARS
0.0/ 100
METRIC RATING
313th/ 347
METRIC RANK
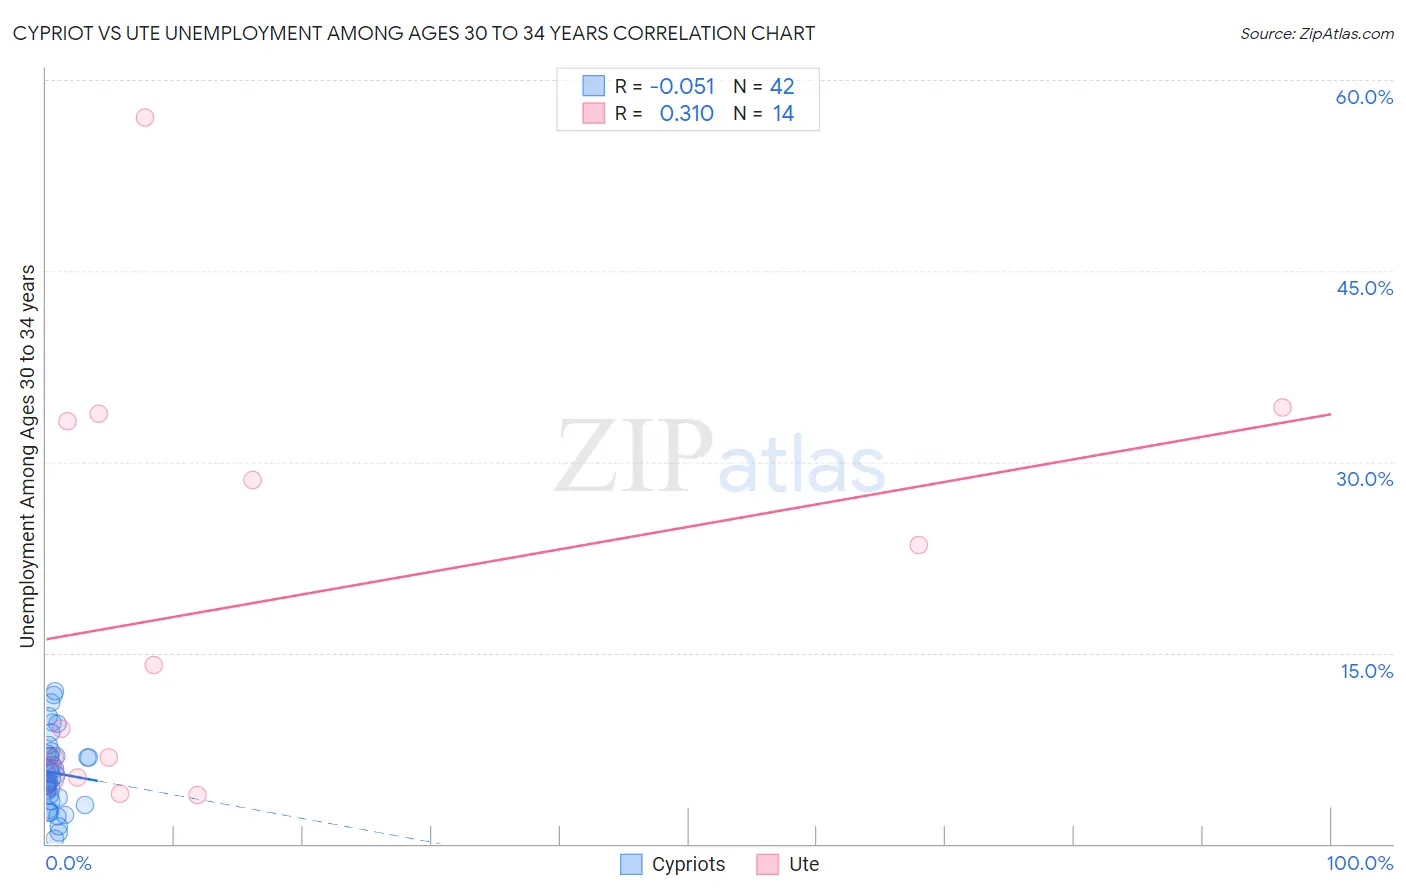
Cypriot vs Ute Unemployment Among Ages 30 to 34 years Correlation Chart
The statistical analysis conducted on geographies consisting of 61,053,204 people shows a slight negative correlation between the proportion of Cypriots and unemployment rate among population between the ages 30 and 34 in the United States with a correlation coefficient (R) of -0.051 and weighted average of 5.1%. Similarly, the statistical analysis conducted on geographies consisting of 54,847,910 people shows a mild positive correlation between the proportion of Ute and unemployment rate among population between the ages 30 and 34 in the United States with a correlation coefficient (R) of 0.310 and weighted average of 7.0%, a difference of 38.9%.
Unemployment Among Ages 30 to 34 years Correlation Summary
| Measurement | Cypriot | Ute |
| Minimum | 0.40% | 3.8% |
| Maximum | 12.0% | 57.1% |
| Range | 11.6% | 53.3% |
| Mean | 5.6% | 19.0% |
| Median | 5.3% | 11.5% |
| Interquartile 25% (IQ1) | 3.6% | 5.3% |
| Interquartile 75% (IQ3) | 6.9% | 33.2% |
| Interquartile Range (IQR) | 3.3% | 27.9% |
| Standard Deviation (Sample) | 2.8% | 16.4% |
| Standard Deviation (Population) | 2.8% | 15.8% |
Similar Demographics by Unemployment Among Ages 30 to 34 years
Demographics Similar to Cypriots by Unemployment Among Ages 30 to 34 years
In terms of unemployment among ages 30 to 34 years, the demographic groups most similar to Cypriots are Assyrian/Chaldean/Syriac (5.1%, a difference of 0.020%), Immigrants from Congo (5.1%, a difference of 0.030%), Immigrants from Malaysia (5.1%, a difference of 0.14%), Puget Sound Salish (5.1%, a difference of 0.21%), and Turkish (5.1%, a difference of 0.25%).
| Demographics | Rating | Rank | Unemployment Among Ages 30 to 34 years |
| Immigrants | Vietnam | 98.9 /100 | #40 | Exceptional 5.0% |
| Immigrants | Eastern Africa | 98.9 /100 | #41 | Exceptional 5.0% |
| Immigrants | Hong Kong | 98.8 /100 | #42 | Exceptional 5.0% |
| Soviet Union | 98.8 /100 | #43 | Exceptional 5.0% |
| Immigrants | Belgium | 98.7 /100 | #44 | Exceptional 5.1% |
| Yugoslavians | 98.6 /100 | #45 | Exceptional 5.1% |
| Immigrants | Congo | 98.4 /100 | #46 | Exceptional 5.1% |
| Cypriots | 98.4 /100 | #47 | Exceptional 5.1% |
| Assyrians/Chaldeans/Syriacs | 98.4 /100 | #48 | Exceptional 5.1% |
| Immigrants | Malaysia | 98.3 /100 | #49 | Exceptional 5.1% |
| Puget Sound Salish | 98.2 /100 | #50 | Exceptional 5.1% |
| Turks | 98.2 /100 | #51 | Exceptional 5.1% |
| Immigrants | Burma/Myanmar | 98.1 /100 | #52 | Exceptional 5.1% |
| Cubans | 98.1 /100 | #53 | Exceptional 5.1% |
| Immigrants | Morocco | 97.9 /100 | #54 | Exceptional 5.1% |
Demographics Similar to Ute by Unemployment Among Ages 30 to 34 years
In terms of unemployment among ages 30 to 34 years, the demographic groups most similar to Ute are British West Indian (7.0%, a difference of 0.040%), Alaskan Athabascan (7.0%, a difference of 0.12%), Lumbee (7.1%, a difference of 0.21%), Aleut (7.1%, a difference of 0.58%), and Immigrants from St. Vincent and the Grenadines (7.0%, a difference of 1.2%).
| Demographics | Rating | Rank | Unemployment Among Ages 30 to 34 years |
| Immigrants | Armenia | 0.0 /100 | #306 | Tragic 6.8% |
| Immigrants | Belize | 0.0 /100 | #307 | Tragic 6.9% |
| Immigrants | Azores | 0.0 /100 | #308 | Tragic 6.9% |
| Immigrants | Grenada | 0.0 /100 | #309 | Tragic 6.9% |
| Immigrants | St. Vincent and the Grenadines | 0.0 /100 | #310 | Tragic 7.0% |
| Alaskan Athabascans | 0.0 /100 | #311 | Tragic 7.0% |
| British West Indians | 0.0 /100 | #312 | Tragic 7.0% |
| Ute | 0.0 /100 | #313 | Tragic 7.0% |
| Lumbee | 0.0 /100 | #314 | Tragic 7.1% |
| Aleuts | 0.0 /100 | #315 | Tragic 7.1% |
| Houma | 0.0 /100 | #316 | Tragic 7.2% |
| Immigrants | Cabo Verde | 0.0 /100 | #317 | Tragic 7.2% |
| Blacks/African Americans | 0.0 /100 | #318 | Tragic 7.2% |
| Guyanese | 0.0 /100 | #319 | Tragic 7.2% |
| Cape Verdeans | 0.0 /100 | #320 | Tragic 7.2% |