Peruvian vs Navajo Unemployment Among Ages 30 to 34 years
COMPARE
Peruvian
Navajo
Unemployment Among Ages 30 to 34 years
Unemployment Among Ages 30 to 34 years Comparison
Peruvians
Navajo
5.5%
UNEMPLOYMENT AMONG AGES 30 TO 34 YEARS
50.2/ 100
METRIC RATING
173rd/ 347
METRIC RANK
10.6%
UNEMPLOYMENT AMONG AGES 30 TO 34 YEARS
0.0/ 100
METRIC RATING
341st/ 347
METRIC RANK
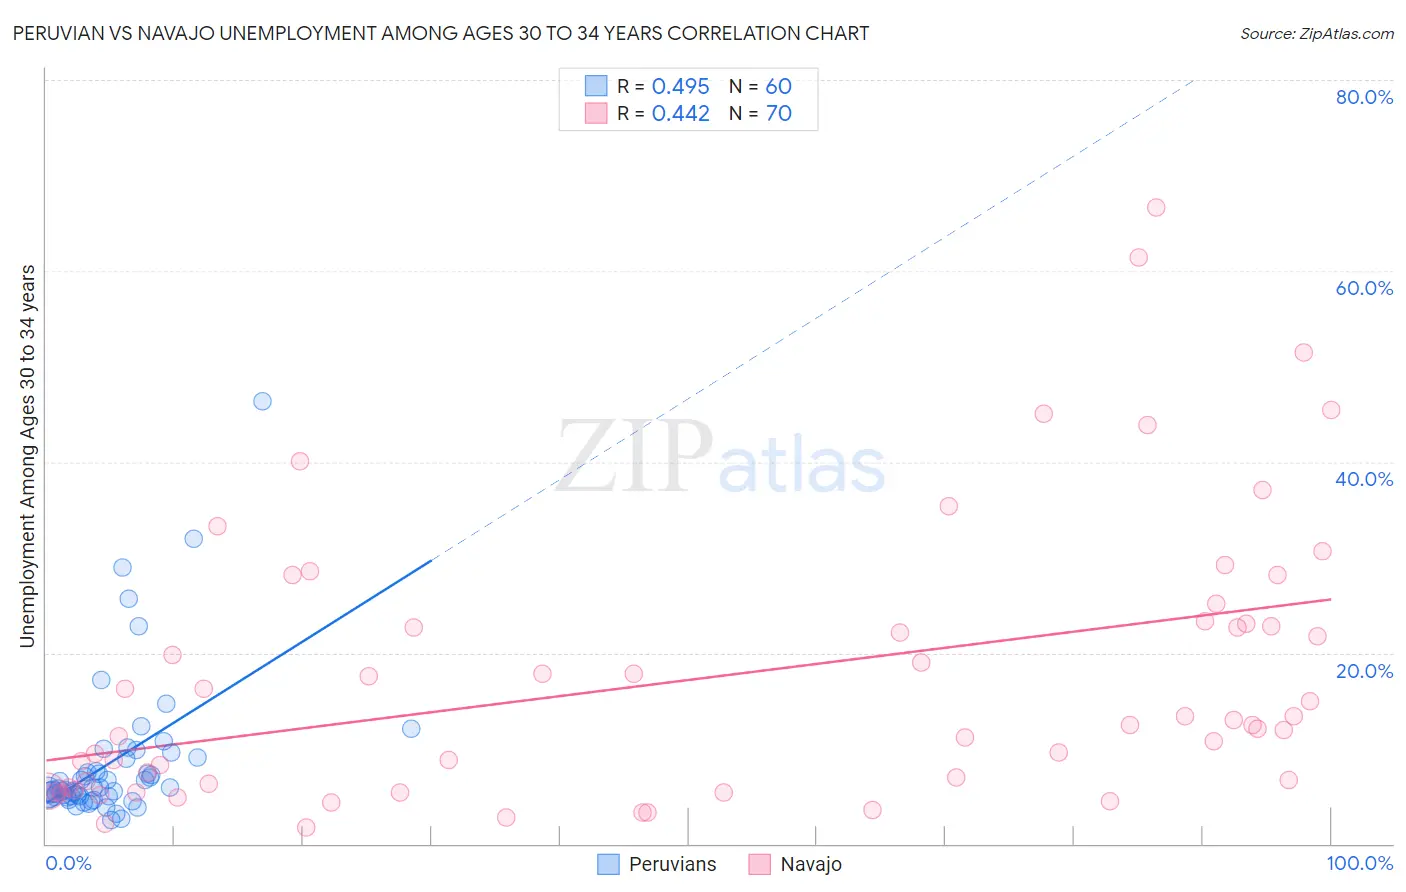
Peruvian vs Navajo Unemployment Among Ages 30 to 34 years Correlation Chart
The statistical analysis conducted on geographies consisting of 346,915,622 people shows a moderate positive correlation between the proportion of Peruvians and unemployment rate among population between the ages 30 and 34 in the United States with a correlation coefficient (R) of 0.495 and weighted average of 5.5%. Similarly, the statistical analysis conducted on geographies consisting of 217,031,350 people shows a moderate positive correlation between the proportion of Navajo and unemployment rate among population between the ages 30 and 34 in the United States with a correlation coefficient (R) of 0.442 and weighted average of 10.6%, a difference of 93.3%.
Unemployment Among Ages 30 to 34 years Correlation Summary
| Measurement | Peruvian | Navajo |
| Minimum | 2.5% | 1.7% |
| Maximum | 46.4% | 66.7% |
| Range | 43.9% | 65.0% |
| Mean | 8.6% | 17.4% |
| Median | 5.8% | 12.5% |
| Interquartile 25% (IQ1) | 5.0% | 5.9% |
| Interquartile 75% (IQ3) | 8.9% | 23.1% |
| Interquartile Range (IQR) | 4.0% | 17.2% |
| Standard Deviation (Sample) | 7.8% | 14.5% |
| Standard Deviation (Population) | 7.7% | 14.4% |
Similar Demographics by Unemployment Among Ages 30 to 34 years
Demographics Similar to Peruvians by Unemployment Among Ages 30 to 34 years
In terms of unemployment among ages 30 to 34 years, the demographic groups most similar to Peruvians are Immigrants from Laos (5.5%, a difference of 0.010%), Afghan (5.5%, a difference of 0.040%), Immigrants from Austria (5.5%, a difference of 0.080%), Scottish (5.5%, a difference of 0.11%), and Immigrants from Peru (5.5%, a difference of 0.15%).
| Demographics | Rating | Rank | Unemployment Among Ages 30 to 34 years |
| Immigrants | Thailand | 55.6 /100 | #166 | Average 5.4% |
| English | 54.8 /100 | #167 | Average 5.4% |
| South Americans | 52.9 /100 | #168 | Average 5.4% |
| Immigrants | Israel | 52.9 /100 | #169 | Average 5.4% |
| Dutch | 52.6 /100 | #170 | Average 5.5% |
| Scottish | 51.8 /100 | #171 | Average 5.5% |
| Immigrants | Austria | 51.3 /100 | #172 | Average 5.5% |
| Peruvians | 50.2 /100 | #173 | Average 5.5% |
| Immigrants | Laos | 50.0 /100 | #174 | Average 5.5% |
| Afghans | 49.6 /100 | #175 | Average 5.5% |
| Immigrants | Peru | 48.0 /100 | #176 | Average 5.5% |
| Immigrants | Ukraine | 47.7 /100 | #177 | Average 5.5% |
| Macedonians | 47.1 /100 | #178 | Average 5.5% |
| Costa Ricans | 46.7 /100 | #179 | Average 5.5% |
| Italians | 45.5 /100 | #180 | Average 5.5% |
Demographics Similar to Navajo by Unemployment Among Ages 30 to 34 years
In terms of unemployment among ages 30 to 34 years, the demographic groups most similar to Navajo are Yuman (10.6%, a difference of 0.40%), Crow (10.3%, a difference of 2.0%), Inupiat (10.8%, a difference of 2.5%), Tohono O'odham (9.8%, a difference of 7.3%), and Yakama (9.8%, a difference of 8.1%).
| Demographics | Rating | Rank | Unemployment Among Ages 30 to 34 years |
| Pueblo | 0.0 /100 | #333 | Tragic 8.3% |
| Alaska Natives | 0.0 /100 | #334 | Tragic 8.5% |
| Puerto Ricans | 0.0 /100 | #335 | Tragic 8.9% |
| Colville | 0.0 /100 | #336 | Tragic 9.0% |
| Pima | 0.0 /100 | #337 | Tragic 9.6% |
| Yakama | 0.0 /100 | #338 | Tragic 9.8% |
| Tohono O'odham | 0.0 /100 | #339 | Tragic 9.8% |
| Crow | 0.0 /100 | #340 | Tragic 10.3% |
| Navajo | 0.0 /100 | #341 | Tragic 10.6% |
| Yuman | 0.0 /100 | #342 | Tragic 10.6% |
| Inupiat | 0.0 /100 | #343 | Tragic 10.8% |
| Hopi | 0.0 /100 | #344 | Tragic 11.9% |
| Arapaho | 0.0 /100 | #345 | Tragic 12.8% |
| Tsimshian | 0.0 /100 | #346 | Tragic 13.8% |
| Yup'ik | 0.0 /100 | #347 | Tragic 18.5% |