Cuban vs Soviet Union Unemployment Among Ages 16 to 19 years
COMPARE
Cuban
Soviet Union
Unemployment Among Ages 16 to 19 years
Unemployment Among Ages 16 to 19 years Comparison
Cubans
Soviet Union
16.9%
UNEMPLOYMENT AMONG AGES 16 TO 19 YEARS
95.8/ 100
METRIC RATING
93rd/ 347
METRIC RANK
16.8%
UNEMPLOYMENT AMONG AGES 16 TO 19 YEARS
97.8/ 100
METRIC RATING
78th/ 347
METRIC RANK
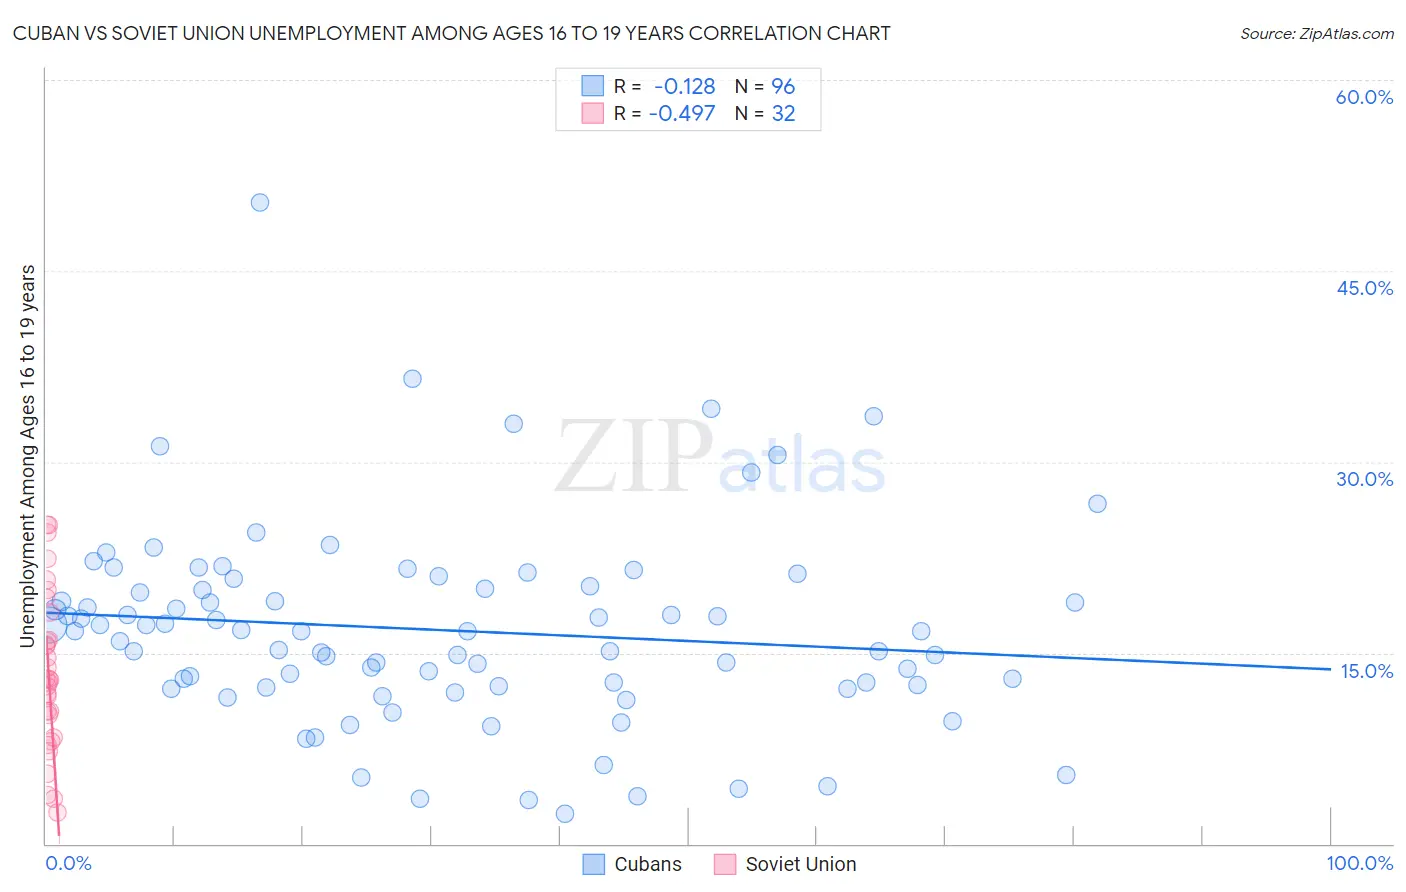
Cuban vs Soviet Union Unemployment Among Ages 16 to 19 years Correlation Chart
The statistical analysis conducted on geographies consisting of 422,554,799 people shows a poor negative correlation between the proportion of Cubans and unemployment rate among population between the ages 16 and 19 in the United States with a correlation coefficient (R) of -0.128 and weighted average of 16.9%. Similarly, the statistical analysis conducted on geographies consisting of 43,026,964 people shows a moderate negative correlation between the proportion of Soviet Union and unemployment rate among population between the ages 16 and 19 in the United States with a correlation coefficient (R) of -0.497 and weighted average of 16.8%, a difference of 0.80%.
Unemployment Among Ages 16 to 19 years Correlation Summary
| Measurement | Cuban | Soviet Union |
| Minimum | 2.4% | 2.5% |
| Maximum | 50.4% | 25.1% |
| Range | 48.0% | 22.6% |
| Mean | 16.8% | 13.5% |
| Median | 16.7% | 12.9% |
| Interquartile 25% (IQ1) | 12.4% | 9.2% |
| Interquartile 75% (IQ3) | 20.1% | 17.1% |
| Interquartile Range (IQR) | 7.7% | 7.9% |
| Standard Deviation (Sample) | 7.7% | 6.2% |
| Standard Deviation (Population) | 7.7% | 6.1% |
Demographics Similar to Cubans and Soviet Union by Unemployment Among Ages 16 to 19 years
In terms of unemployment among ages 16 to 19 years, the demographic groups most similar to Cubans are Bangladeshi (16.9%, a difference of 0.010%), South African (16.9%, a difference of 0.040%), Mongolian (16.9%, a difference of 0.080%), Cambodian (16.9%, a difference of 0.17%), and Asian (16.9%, a difference of 0.25%). Similarly, the demographic groups most similar to Soviet Union are Immigrants from Singapore (16.8%, a difference of 0.020%), Immigrants from North America (16.8%, a difference of 0.090%), New Zealander (16.8%, a difference of 0.15%), Slovak (16.8%, a difference of 0.15%), and French Canadian (16.8%, a difference of 0.15%).
| Demographics | Rating | Rank | Unemployment Among Ages 16 to 19 years |
| New Zealanders | 98.0 /100 | #75 | Exceptional 16.8% |
| Immigrants | North America | 97.9 /100 | #76 | Exceptional 16.8% |
| Immigrants | Singapore | 97.8 /100 | #77 | Exceptional 16.8% |
| Soviet Union | 97.8 /100 | #78 | Exceptional 16.8% |
| Slovaks | 97.5 /100 | #79 | Exceptional 16.8% |
| French Canadians | 97.5 /100 | #80 | Exceptional 16.8% |
| Immigrants | Latvia | 97.5 /100 | #81 | Exceptional 16.8% |
| Whites/Caucasians | 97.5 /100 | #82 | Exceptional 16.8% |
| Ugandans | 97.4 /100 | #83 | Exceptional 16.8% |
| French | 97.4 /100 | #84 | Exceptional 16.8% |
| Immigrants | Kuwait | 97.2 /100 | #85 | Exceptional 16.8% |
| Immigrants | Scotland | 97.2 /100 | #86 | Exceptional 16.8% |
| Greeks | 97.0 /100 | #87 | Exceptional 16.9% |
| Immigrants | South Africa | 96.9 /100 | #88 | Exceptional 16.9% |
| Canadians | 96.7 /100 | #89 | Exceptional 16.9% |
| Asians | 96.6 /100 | #90 | Exceptional 16.9% |
| Cambodians | 96.3 /100 | #91 | Exceptional 16.9% |
| South Africans | 95.9 /100 | #92 | Exceptional 16.9% |
| Cubans | 95.8 /100 | #93 | Exceptional 16.9% |
| Bangladeshis | 95.8 /100 | #94 | Exceptional 16.9% |
| Mongolians | 95.6 /100 | #95 | Exceptional 16.9% |