Immigrants from Vietnam vs Soviet Union Unemployment Among Ages 16 to 19 years
COMPARE
Immigrants from Vietnam
Soviet Union
Unemployment Among Ages 16 to 19 years
Unemployment Among Ages 16 to 19 years Comparison
Immigrants from Vietnam
Soviet Union
16.4%
UNEMPLOYMENT AMONG AGES 16 TO 19 YEARS
99.7/ 100
METRIC RATING
47th/ 347
METRIC RANK
16.8%
UNEMPLOYMENT AMONG AGES 16 TO 19 YEARS
97.8/ 100
METRIC RATING
78th/ 347
METRIC RANK
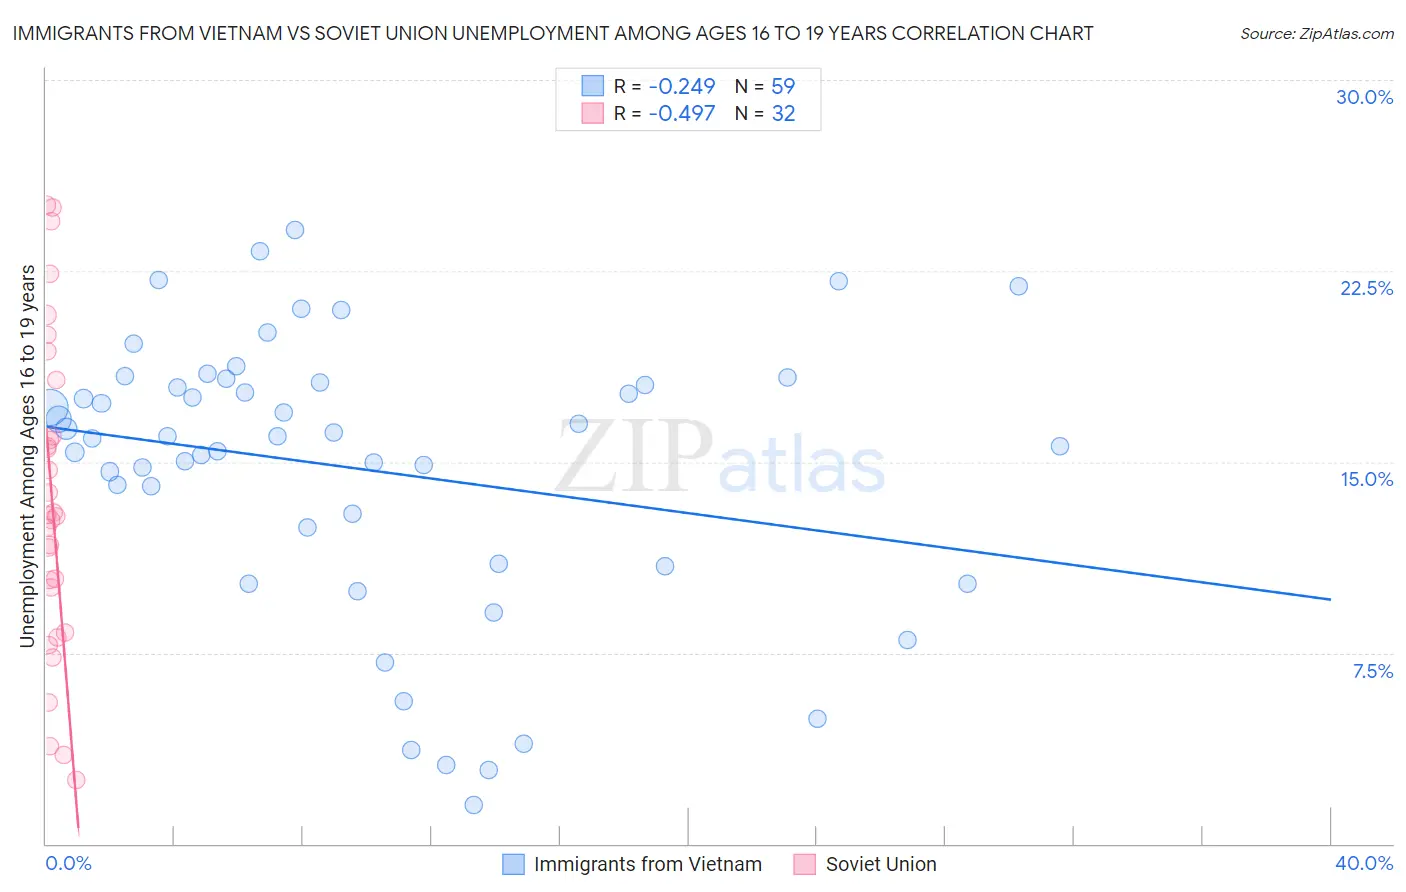
Immigrants from Vietnam vs Soviet Union Unemployment Among Ages 16 to 19 years Correlation Chart
The statistical analysis conducted on geographies consisting of 385,853,252 people shows a weak negative correlation between the proportion of Immigrants from Vietnam and unemployment rate among population between the ages 16 and 19 in the United States with a correlation coefficient (R) of -0.249 and weighted average of 16.4%. Similarly, the statistical analysis conducted on geographies consisting of 43,026,964 people shows a moderate negative correlation between the proportion of Soviet Union and unemployment rate among population between the ages 16 and 19 in the United States with a correlation coefficient (R) of -0.497 and weighted average of 16.8%, a difference of 2.6%.
Unemployment Among Ages 16 to 19 years Correlation Summary
| Measurement | Immigrants from Vietnam | Soviet Union |
| Minimum | 1.5% | 2.5% |
| Maximum | 24.1% | 25.1% |
| Range | 22.6% | 22.6% |
| Mean | 14.7% | 13.5% |
| Median | 16.0% | 12.9% |
| Interquartile 25% (IQ1) | 11.0% | 9.2% |
| Interquartile 75% (IQ3) | 18.1% | 17.1% |
| Interquartile Range (IQR) | 7.1% | 7.9% |
| Standard Deviation (Sample) | 5.5% | 6.2% |
| Standard Deviation (Population) | 5.4% | 6.1% |
Similar Demographics by Unemployment Among Ages 16 to 19 years
Demographics Similar to Immigrants from Vietnam by Unemployment Among Ages 16 to 19 years
In terms of unemployment among ages 16 to 19 years, the demographic groups most similar to Immigrants from Vietnam are Maltese (16.4%, a difference of 0.040%), Immigrants from North Macedonia (16.4%, a difference of 0.070%), Polish (16.4%, a difference of 0.090%), Immigrants from Zimbabwe (16.3%, a difference of 0.11%), and Iraqi (16.4%, a difference of 0.12%).
| Demographics | Rating | Rank | Unemployment Among Ages 16 to 19 years |
| Hmong | 99.8 /100 | #40 | Exceptional 16.3% |
| Immigrants | Nepal | 99.8 /100 | #41 | Exceptional 16.3% |
| Fijians | 99.8 /100 | #42 | Exceptional 16.3% |
| Immigrants | Lebanon | 99.8 /100 | #43 | Exceptional 16.3% |
| Immigrants | Zimbabwe | 99.7 /100 | #44 | Exceptional 16.3% |
| Poles | 99.7 /100 | #45 | Exceptional 16.4% |
| Immigrants | North Macedonia | 99.7 /100 | #46 | Exceptional 16.4% |
| Immigrants | Vietnam | 99.7 /100 | #47 | Exceptional 16.4% |
| Maltese | 99.7 /100 | #48 | Exceptional 16.4% |
| Iraqis | 99.7 /100 | #49 | Exceptional 16.4% |
| Bhutanese | 99.6 /100 | #50 | Exceptional 16.4% |
| Lebanese | 99.6 /100 | #51 | Exceptional 16.4% |
| Welsh | 99.6 /100 | #52 | Exceptional 16.4% |
| Slovenes | 99.6 /100 | #53 | Exceptional 16.4% |
| British | 99.5 /100 | #54 | Exceptional 16.5% |
Demographics Similar to Soviet Union by Unemployment Among Ages 16 to 19 years
In terms of unemployment among ages 16 to 19 years, the demographic groups most similar to Soviet Union are Immigrants from Singapore (16.8%, a difference of 0.020%), Immigrants from North America (16.8%, a difference of 0.090%), New Zealander (16.8%, a difference of 0.15%), Slovak (16.8%, a difference of 0.15%), and French Canadian (16.8%, a difference of 0.15%).
| Demographics | Rating | Rank | Unemployment Among Ages 16 to 19 years |
| Latvians | 98.5 /100 | #71 | Exceptional 16.7% |
| Immigrants | Canada | 98.5 /100 | #72 | Exceptional 16.7% |
| Lithuanians | 98.2 /100 | #73 | Exceptional 16.7% |
| Immigrants | Eastern Africa | 98.1 /100 | #74 | Exceptional 16.8% |
| New Zealanders | 98.0 /100 | #75 | Exceptional 16.8% |
| Immigrants | North America | 97.9 /100 | #76 | Exceptional 16.8% |
| Immigrants | Singapore | 97.8 /100 | #77 | Exceptional 16.8% |
| Soviet Union | 97.8 /100 | #78 | Exceptional 16.8% |
| Slovaks | 97.5 /100 | #79 | Exceptional 16.8% |
| French Canadians | 97.5 /100 | #80 | Exceptional 16.8% |
| Immigrants | Latvia | 97.5 /100 | #81 | Exceptional 16.8% |
| Whites/Caucasians | 97.5 /100 | #82 | Exceptional 16.8% |
| Ugandans | 97.4 /100 | #83 | Exceptional 16.8% |
| French | 97.4 /100 | #84 | Exceptional 16.8% |
| Immigrants | Kuwait | 97.2 /100 | #85 | Exceptional 16.8% |