Cuban vs Immigrants from Portugal Unemployment Among Ages 16 to 19 years
COMPARE
Cuban
Immigrants from Portugal
Unemployment Among Ages 16 to 19 years
Unemployment Among Ages 16 to 19 years Comparison
Cubans
Immigrants from Portugal
16.9%
UNEMPLOYMENT AMONG AGES 16 TO 19 YEARS
95.8/ 100
METRIC RATING
93rd/ 347
METRIC RANK
17.8%
UNEMPLOYMENT AMONG AGES 16 TO 19 YEARS
27.2/ 100
METRIC RATING
202nd/ 347
METRIC RANK
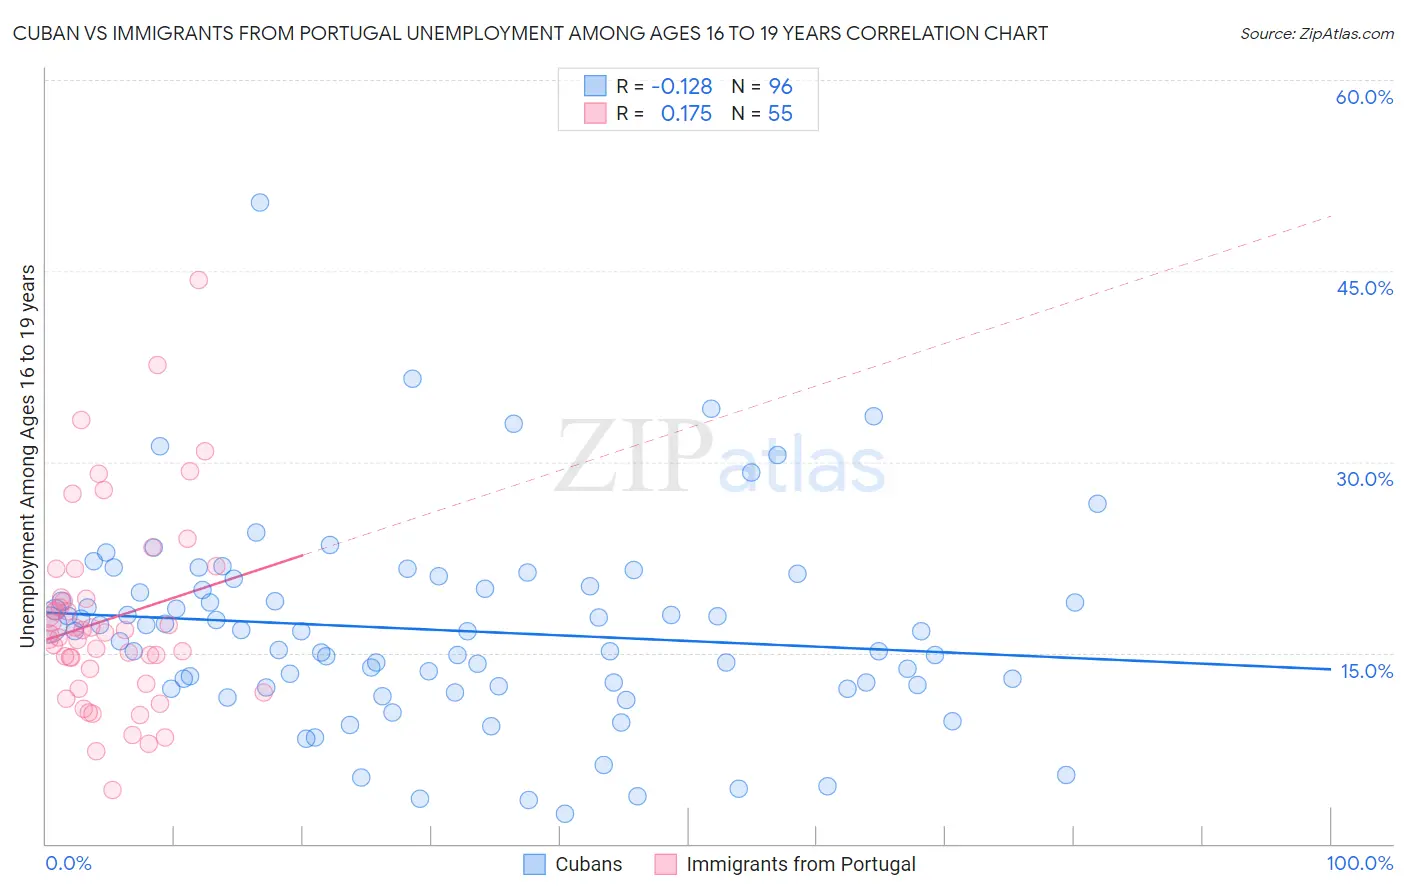
Cuban vs Immigrants from Portugal Unemployment Among Ages 16 to 19 years Correlation Chart
The statistical analysis conducted on geographies consisting of 422,554,799 people shows a poor negative correlation between the proportion of Cubans and unemployment rate among population between the ages 16 and 19 in the United States with a correlation coefficient (R) of -0.128 and weighted average of 16.9%. Similarly, the statistical analysis conducted on geographies consisting of 168,658,377 people shows a poor positive correlation between the proportion of Immigrants from Portugal and unemployment rate among population between the ages 16 and 19 in the United States with a correlation coefficient (R) of 0.175 and weighted average of 17.8%, a difference of 5.1%.
Unemployment Among Ages 16 to 19 years Correlation Summary
| Measurement | Cuban | Immigrants from Portugal |
| Minimum | 2.4% | 4.2% |
| Maximum | 50.4% | 44.3% |
| Range | 48.0% | 40.1% |
| Mean | 16.8% | 17.7% |
| Median | 16.7% | 16.5% |
| Interquartile 25% (IQ1) | 12.4% | 12.6% |
| Interquartile 75% (IQ3) | 20.1% | 19.3% |
| Interquartile Range (IQR) | 7.7% | 6.7% |
| Standard Deviation (Sample) | 7.7% | 7.6% |
| Standard Deviation (Population) | 7.7% | 7.6% |
Similar Demographics by Unemployment Among Ages 16 to 19 years
Demographics Similar to Cubans by Unemployment Among Ages 16 to 19 years
In terms of unemployment among ages 16 to 19 years, the demographic groups most similar to Cubans are Bangladeshi (16.9%, a difference of 0.010%), South African (16.9%, a difference of 0.040%), Mongolian (16.9%, a difference of 0.080%), Ottawa (16.9%, a difference of 0.12%), and Immigrants from Venezuela (16.9%, a difference of 0.14%).
| Demographics | Rating | Rank | Unemployment Among Ages 16 to 19 years |
| Immigrants | Scotland | 97.2 /100 | #86 | Exceptional 16.8% |
| Greeks | 97.0 /100 | #87 | Exceptional 16.9% |
| Immigrants | South Africa | 96.9 /100 | #88 | Exceptional 16.9% |
| Canadians | 96.7 /100 | #89 | Exceptional 16.9% |
| Asians | 96.6 /100 | #90 | Exceptional 16.9% |
| Cambodians | 96.3 /100 | #91 | Exceptional 16.9% |
| South Africans | 95.9 /100 | #92 | Exceptional 16.9% |
| Cubans | 95.8 /100 | #93 | Exceptional 16.9% |
| Bangladeshis | 95.8 /100 | #94 | Exceptional 16.9% |
| Mongolians | 95.6 /100 | #95 | Exceptional 16.9% |
| Ottawa | 95.4 /100 | #96 | Exceptional 16.9% |
| Immigrants | Venezuela | 95.3 /100 | #97 | Exceptional 16.9% |
| Burmese | 95.0 /100 | #98 | Exceptional 17.0% |
| Immigrants | Lithuania | 94.9 /100 | #99 | Exceptional 17.0% |
| Immigrants | Thailand | 94.7 /100 | #100 | Exceptional 17.0% |
Demographics Similar to Immigrants from Portugal by Unemployment Among Ages 16 to 19 years
In terms of unemployment among ages 16 to 19 years, the demographic groups most similar to Immigrants from Portugal are Immigrants from Ethiopia (17.8%, a difference of 0.010%), Immigrants from Fiji (17.8%, a difference of 0.030%), Immigrants from Ireland (17.8%, a difference of 0.080%), Ethiopian (17.8%, a difference of 0.14%), and Immigrants from Czechoslovakia (17.8%, a difference of 0.15%).
| Demographics | Rating | Rank | Unemployment Among Ages 16 to 19 years |
| Immigrants | Peru | 37.3 /100 | #195 | Fair 17.7% |
| Alaskan Athabascans | 34.1 /100 | #196 | Fair 17.7% |
| Immigrants | Czechoslovakia | 29.8 /100 | #197 | Fair 17.8% |
| Ethiopians | 29.6 /100 | #198 | Fair 17.8% |
| Immigrants | Ireland | 28.5 /100 | #199 | Fair 17.8% |
| Immigrants | Fiji | 27.7 /100 | #200 | Fair 17.8% |
| Immigrants | Ethiopia | 27.4 /100 | #201 | Fair 17.8% |
| Immigrants | Portugal | 27.2 /100 | #202 | Fair 17.8% |
| Immigrants | Eastern Europe | 23.6 /100 | #203 | Fair 17.8% |
| Immigrants | Nonimmigrants | 20.9 /100 | #204 | Fair 17.9% |
| Assyrians/Chaldeans/Syriacs | 20.8 /100 | #205 | Fair 17.9% |
| Immigrants | Southern Europe | 18.9 /100 | #206 | Poor 17.9% |
| Liberians | 18.6 /100 | #207 | Poor 17.9% |
| Hawaiians | 16.8 /100 | #208 | Poor 17.9% |
| Cherokee | 15.7 /100 | #209 | Poor 17.9% |