Cuban vs Spanish Unemployment Among Ages 16 to 19 years
COMPARE
Cuban
Spanish
Unemployment Among Ages 16 to 19 years
Unemployment Among Ages 16 to 19 years Comparison
Cubans
Spanish
16.9%
UNEMPLOYMENT AMONG AGES 16 TO 19 YEARS
95.8/ 100
METRIC RATING
93rd/ 347
METRIC RANK
17.3%
UNEMPLOYMENT AMONG AGES 16 TO 19 YEARS
79.3/ 100
METRIC RATING
142nd/ 347
METRIC RANK
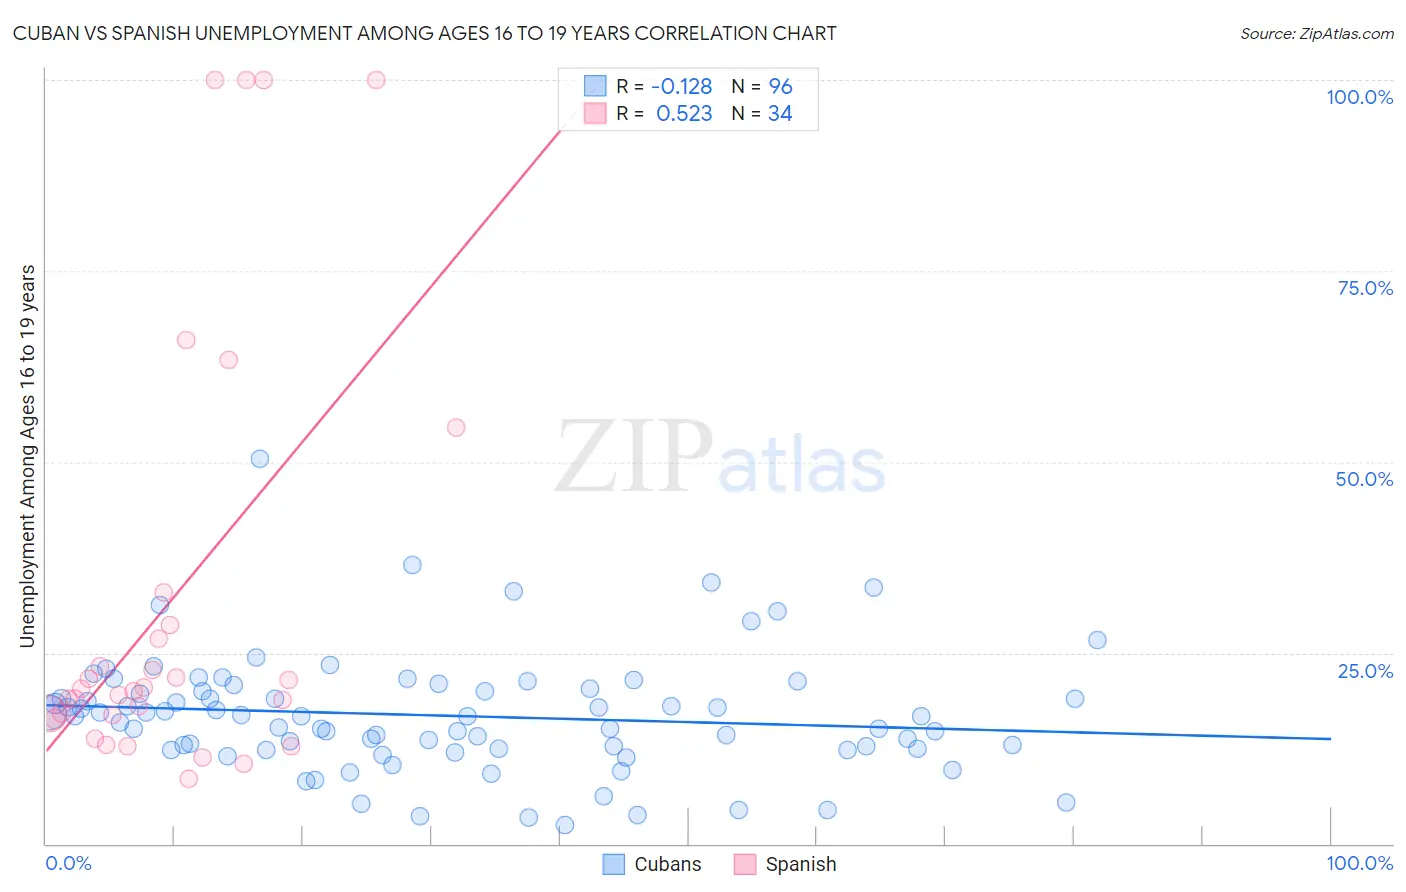
Cuban vs Spanish Unemployment Among Ages 16 to 19 years Correlation Chart
The statistical analysis conducted on geographies consisting of 422,554,799 people shows a poor negative correlation between the proportion of Cubans and unemployment rate among population between the ages 16 and 19 in the United States with a correlation coefficient (R) of -0.128 and weighted average of 16.9%. Similarly, the statistical analysis conducted on geographies consisting of 398,416,899 people shows a substantial positive correlation between the proportion of Spanish and unemployment rate among population between the ages 16 and 19 in the United States with a correlation coefficient (R) of 0.523 and weighted average of 17.3%, a difference of 2.2%.
Unemployment Among Ages 16 to 19 years Correlation Summary
| Measurement | Cuban | Spanish |
| Minimum | 2.4% | 8.4% |
| Maximum | 50.4% | 100.0% |
| Range | 48.0% | 91.6% |
| Mean | 16.8% | 32.0% |
| Median | 16.7% | 20.1% |
| Interquartile 25% (IQ1) | 12.4% | 16.9% |
| Interquartile 75% (IQ3) | 20.1% | 28.6% |
| Interquartile Range (IQR) | 7.7% | 11.7% |
| Standard Deviation (Sample) | 7.7% | 28.5% |
| Standard Deviation (Population) | 7.7% | 28.0% |
Similar Demographics by Unemployment Among Ages 16 to 19 years
Demographics Similar to Cubans by Unemployment Among Ages 16 to 19 years
In terms of unemployment among ages 16 to 19 years, the demographic groups most similar to Cubans are Bangladeshi (16.9%, a difference of 0.010%), South African (16.9%, a difference of 0.040%), Mongolian (16.9%, a difference of 0.080%), Ottawa (16.9%, a difference of 0.12%), and Immigrants from Venezuela (16.9%, a difference of 0.14%).
| Demographics | Rating | Rank | Unemployment Among Ages 16 to 19 years |
| Immigrants | Scotland | 97.2 /100 | #86 | Exceptional 16.8% |
| Greeks | 97.0 /100 | #87 | Exceptional 16.9% |
| Immigrants | South Africa | 96.9 /100 | #88 | Exceptional 16.9% |
| Canadians | 96.7 /100 | #89 | Exceptional 16.9% |
| Asians | 96.6 /100 | #90 | Exceptional 16.9% |
| Cambodians | 96.3 /100 | #91 | Exceptional 16.9% |
| South Africans | 95.9 /100 | #92 | Exceptional 16.9% |
| Cubans | 95.8 /100 | #93 | Exceptional 16.9% |
| Bangladeshis | 95.8 /100 | #94 | Exceptional 16.9% |
| Mongolians | 95.6 /100 | #95 | Exceptional 16.9% |
| Ottawa | 95.4 /100 | #96 | Exceptional 16.9% |
| Immigrants | Venezuela | 95.3 /100 | #97 | Exceptional 16.9% |
| Burmese | 95.0 /100 | #98 | Exceptional 17.0% |
| Immigrants | Lithuania | 94.9 /100 | #99 | Exceptional 17.0% |
| Immigrants | Thailand | 94.7 /100 | #100 | Exceptional 17.0% |
Demographics Similar to Spanish by Unemployment Among Ages 16 to 19 years
In terms of unemployment among ages 16 to 19 years, the demographic groups most similar to Spanish are Immigrants from Egypt (17.3%, a difference of 0.010%), Immigrants from England (17.3%, a difference of 0.020%), Basque (17.3%, a difference of 0.11%), Immigrants from Croatia (17.3%, a difference of 0.12%), and Indian (Asian) (17.3%, a difference of 0.12%).
| Demographics | Rating | Rank | Unemployment Among Ages 16 to 19 years |
| Samoans | 83.7 /100 | #135 | Excellent 17.2% |
| Immigrants | Oceania | 83.1 /100 | #136 | Excellent 17.2% |
| Immigrants | Malaysia | 82.8 /100 | #137 | Excellent 17.2% |
| Bolivians | 81.9 /100 | #138 | Excellent 17.3% |
| Immigrants | Eritrea | 81.1 /100 | #139 | Excellent 17.3% |
| Immigrants | Croatia | 80.8 /100 | #140 | Excellent 17.3% |
| Basques | 80.7 /100 | #141 | Excellent 17.3% |
| Spanish | 79.3 /100 | #142 | Good 17.3% |
| Immigrants | Egypt | 79.1 /100 | #143 | Good 17.3% |
| Immigrants | England | 78.9 /100 | #144 | Good 17.3% |
| Indians (Asian) | 77.6 /100 | #145 | Good 17.3% |
| Turks | 77.1 /100 | #146 | Good 17.3% |
| Tsimshian | 76.0 /100 | #147 | Good 17.3% |
| Romanians | 74.9 /100 | #148 | Good 17.3% |
| Immigrants | Eastern Asia | 73.8 /100 | #149 | Good 17.4% |