Immigrants from Ghana vs Immigrants from Croatia Female Unemployment
COMPARE
Immigrants from Ghana
Immigrants from Croatia
Female Unemployment
Female Unemployment Comparison
Immigrants from Ghana
Immigrants from Croatia
6.0%
FEMALE UNEMPLOYMENT
0.0/ 100
METRIC RATING
277th/ 347
METRIC RANK
5.1%
FEMALE UNEMPLOYMENT
89.9/ 100
METRIC RATING
118th/ 347
METRIC RANK
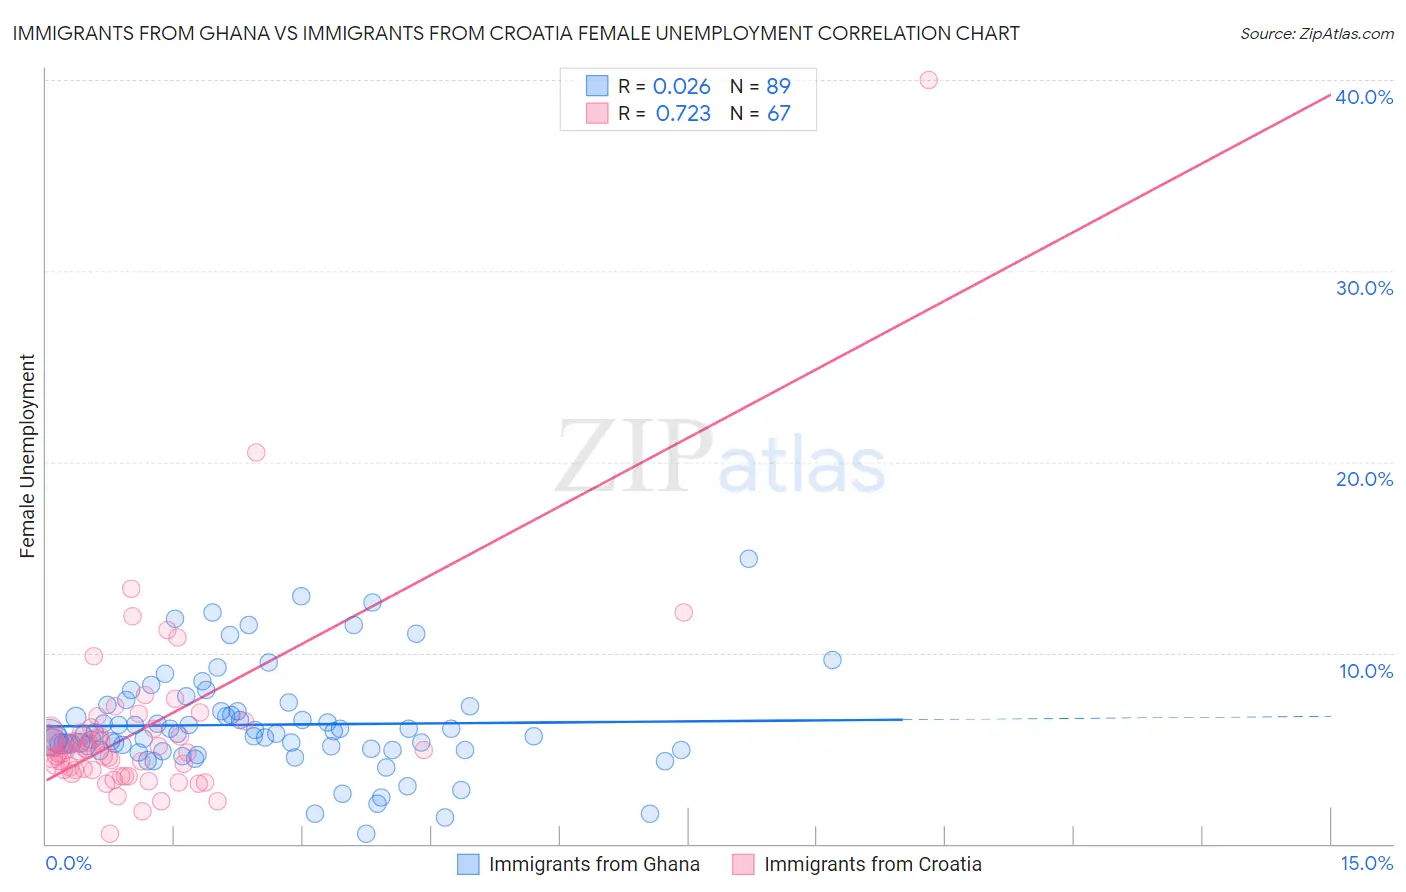
Immigrants from Ghana vs Immigrants from Croatia Female Unemployment Correlation Chart
The statistical analysis conducted on geographies consisting of 199,631,349 people shows no correlation between the proportion of Immigrants from Ghana and unemploymnet rate among females in the United States with a correlation coefficient (R) of 0.026 and weighted average of 6.0%. Similarly, the statistical analysis conducted on geographies consisting of 132,440,567 people shows a strong positive correlation between the proportion of Immigrants from Croatia and unemploymnet rate among females in the United States with a correlation coefficient (R) of 0.723 and weighted average of 5.1%, a difference of 18.1%.
Female Unemployment Correlation Summary
| Measurement | Immigrants from Ghana | Immigrants from Croatia |
| Minimum | 0.50% | 0.50% |
| Maximum | 14.9% | 40.0% |
| Range | 14.4% | 39.5% |
| Mean | 6.2% | 6.0% |
| Median | 5.7% | 4.9% |
| Interquartile 25% (IQ1) | 4.9% | 3.9% |
| Interquartile 75% (IQ3) | 7.1% | 6.0% |
| Interquartile Range (IQR) | 2.2% | 2.1% |
| Standard Deviation (Sample) | 2.6% | 5.2% |
| Standard Deviation (Population) | 2.6% | 5.2% |
Similar Demographics by Female Unemployment
Demographics Similar to Immigrants from Ghana by Female Unemployment
In terms of female unemployment, the demographic groups most similar to Immigrants from Ghana are Yaqui (6.0%, a difference of 0.0%), Armenian (6.0%, a difference of 0.12%), Mexican American Indian (6.0%, a difference of 0.17%), Guatemalan (6.0%, a difference of 0.21%), and Bahamian (6.0%, a difference of 0.40%).
| Demographics | Rating | Rank | Female Unemployment |
| Immigrants | Honduras | 0.0 /100 | #270 | Tragic 5.9% |
| Central Americans | 0.0 /100 | #271 | Tragic 5.9% |
| Lumbee | 0.0 /100 | #272 | Tragic 5.9% |
| Ghanaians | 0.0 /100 | #273 | Tragic 5.9% |
| Africans | 0.0 /100 | #274 | Tragic 5.9% |
| Senegalese | 0.0 /100 | #275 | Tragic 6.0% |
| Bahamians | 0.0 /100 | #276 | Tragic 6.0% |
| Immigrants | Ghana | 0.0 /100 | #277 | Tragic 6.0% |
| Yaqui | 0.0 /100 | #278 | Tragic 6.0% |
| Armenians | 0.0 /100 | #279 | Tragic 6.0% |
| Mexican American Indians | 0.0 /100 | #280 | Tragic 6.0% |
| Guatemalans | 0.0 /100 | #281 | Tragic 6.0% |
| Colville | 0.0 /100 | #282 | Tragic 6.0% |
| Salvadorans | 0.0 /100 | #283 | Tragic 6.0% |
| Immigrants | Senegal | 0.0 /100 | #284 | Tragic 6.1% |
Demographics Similar to Immigrants from Croatia by Female Unemployment
In terms of female unemployment, the demographic groups most similar to Immigrants from Croatia are Jordanian (5.1%, a difference of 0.060%), American (5.1%, a difference of 0.11%), Lebanese (5.1%, a difference of 0.18%), Immigrants from Turkey (5.1%, a difference of 0.20%), and Immigrants from Saudi Arabia (5.1%, a difference of 0.24%).
| Demographics | Rating | Rank | Female Unemployment |
| Immigrants | Burma/Myanmar | 92.3 /100 | #111 | Exceptional 5.1% |
| Estonians | 92.1 /100 | #112 | Exceptional 5.1% |
| Immigrants | Saudi Arabia | 91.2 /100 | #113 | Exceptional 5.1% |
| Immigrants | Turkey | 91.0 /100 | #114 | Exceptional 5.1% |
| Lebanese | 91.0 /100 | #115 | Exceptional 5.1% |
| Americans | 90.5 /100 | #116 | Exceptional 5.1% |
| Jordanians | 90.3 /100 | #117 | Exceptional 5.1% |
| Immigrants | Croatia | 89.9 /100 | #118 | Excellent 5.1% |
| Immigrants | North Macedonia | 88.3 /100 | #119 | Excellent 5.1% |
| Immigrants | Romania | 88.1 /100 | #120 | Excellent 5.1% |
| Immigrants | Western Europe | 88.1 /100 | #121 | Excellent 5.1% |
| Immigrants | Germany | 87.6 /100 | #122 | Excellent 5.1% |
| Immigrants | South Africa | 87.6 /100 | #123 | Excellent 5.1% |
| Immigrants | Europe | 87.2 /100 | #124 | Excellent 5.1% |
| Basques | 86.5 /100 | #125 | Excellent 5.1% |