Crow vs Scottish Unemployment Among Youth under 25 years
COMPARE
Crow
Scottish
Unemployment Among Youth under 25 years
Unemployment Among Youth under 25 years Comparison
Crow
Scottish
20.1%
UNEMPLOYMENT AMONG YOUTH UNDER 25 YEARS
0.0/ 100
METRIC RATING
344th/ 347
METRIC RANK
10.9%
UNEMPLOYMENT AMONG YOUTH UNDER 25 YEARS
99.8/ 100
METRIC RATING
40th/ 347
METRIC RANK
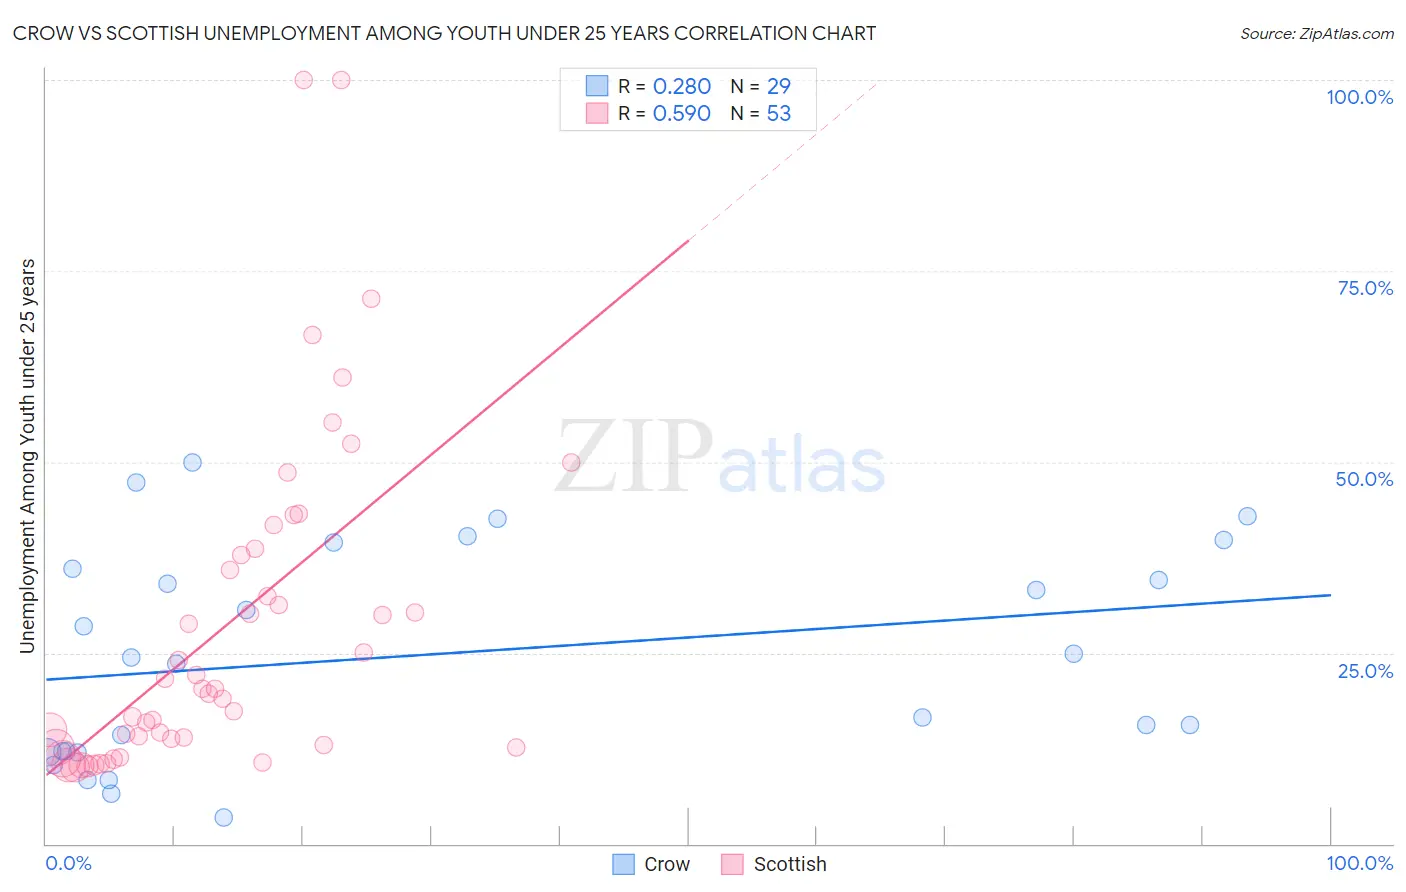
Crow vs Scottish Unemployment Among Youth under 25 years Correlation Chart
The statistical analysis conducted on geographies consisting of 58,938,445 people shows a weak positive correlation between the proportion of Crow and unemployment rate among youth under the age of 25 in the United States with a correlation coefficient (R) of 0.280 and weighted average of 20.1%. Similarly, the statistical analysis conducted on geographies consisting of 542,532,061 people shows a substantial positive correlation between the proportion of Scottish and unemployment rate among youth under the age of 25 in the United States with a correlation coefficient (R) of 0.590 and weighted average of 10.9%, a difference of 84.5%.
Unemployment Among Youth under 25 years Correlation Summary
| Measurement | Crow | Scottish |
| Minimum | 3.4% | 9.9% |
| Maximum | 49.9% | 100.0% |
| Range | 46.5% | 90.1% |
| Mean | 24.8% | 28.4% |
| Median | 24.4% | 20.3% |
| Interquartile 25% (IQ1) | 12.0% | 12.8% |
| Interquartile 75% (IQ3) | 37.7% | 38.2% |
| Interquartile Range (IQR) | 25.7% | 25.5% |
| Standard Deviation (Sample) | 13.9% | 21.5% |
| Standard Deviation (Population) | 13.7% | 21.3% |
Similar Demographics by Unemployment Among Youth under 25 years
Demographics Similar to Crow by Unemployment Among Youth under 25 years
In terms of unemployment among youth under 25 years, the demographic groups most similar to Crow are Hopi (21.5%, a difference of 7.0%), Navajo (18.6%, a difference of 7.8%), Puerto Rican (18.4%, a difference of 9.0%), Inupiat (22.0%, a difference of 9.6%), and Paiute (17.6%, a difference of 14.3%).
| Demographics | Rating | Rank | Unemployment Among Youth under 25 years |
| Guyanese | 0.0 /100 | #333 | Tragic 15.9% |
| Immigrants | Guyana | 0.0 /100 | #334 | Tragic 15.9% |
| Immigrants | St. Vincent and the Grenadines | 0.0 /100 | #335 | Tragic 16.1% |
| Pima | 0.0 /100 | #336 | Tragic 16.2% |
| Arapaho | 0.0 /100 | #337 | Tragic 16.3% |
| Yuman | 0.0 /100 | #338 | Tragic 16.3% |
| Tsimshian | 0.0 /100 | #339 | Tragic 16.5% |
| Colville | 0.0 /100 | #340 | Tragic 16.8% |
| Paiute | 0.0 /100 | #341 | Tragic 17.6% |
| Puerto Ricans | 0.0 /100 | #342 | Tragic 18.4% |
| Navajo | 0.0 /100 | #343 | Tragic 18.6% |
| Crow | 0.0 /100 | #344 | Tragic 20.1% |
| Hopi | 0.0 /100 | #345 | Tragic 21.5% |
| Inupiat | 0.0 /100 | #346 | Tragic 22.0% |
| Yup'ik | 0.0 /100 | #347 | Tragic 23.7% |
Demographics Similar to Scottish by Unemployment Among Youth under 25 years
In terms of unemployment among youth under 25 years, the demographic groups most similar to Scottish are Croatian (10.9%, a difference of 0.10%), Immigrants from Zaire (10.9%, a difference of 0.16%), Immigrants from Congo (10.9%, a difference of 0.17%), Cambodian (10.9%, a difference of 0.17%), and Immigrants from Zimbabwe (10.8%, a difference of 0.24%).
| Demographics | Rating | Rank | Unemployment Among Youth under 25 years |
| Europeans | 99.9 /100 | #33 | Exceptional 10.8% |
| English | 99.9 /100 | #34 | Exceptional 10.8% |
| Immigrants | Nepal | 99.9 /100 | #35 | Exceptional 10.8% |
| Hmong | 99.8 /100 | #36 | Exceptional 10.8% |
| Immigrants | Zimbabwe | 99.8 /100 | #37 | Exceptional 10.8% |
| Immigrants | Congo | 99.8 /100 | #38 | Exceptional 10.9% |
| Immigrants | Zaire | 99.8 /100 | #39 | Exceptional 10.9% |
| Scottish | 99.8 /100 | #40 | Exceptional 10.9% |
| Croatians | 99.8 /100 | #41 | Exceptional 10.9% |
| Cambodians | 99.7 /100 | #42 | Exceptional 10.9% |
| British | 99.7 /100 | #43 | Exceptional 10.9% |
| Welsh | 99.7 /100 | #44 | Exceptional 10.9% |
| Bulgarians | 99.6 /100 | #45 | Exceptional 10.9% |
| Tongans | 99.6 /100 | #46 | Exceptional 10.9% |
| Australians | 99.6 /100 | #47 | Exceptional 10.9% |