Crow vs Central American Unemployment Among Youth under 25 years
COMPARE
Crow
Central American
Unemployment Among Youth under 25 years
Unemployment Among Youth under 25 years Comparison
Crow
Central Americans
20.1%
UNEMPLOYMENT AMONG YOUTH UNDER 25 YEARS
0.0/ 100
METRIC RATING
344th/ 347
METRIC RANK
12.2%
UNEMPLOYMENT AMONG YOUTH UNDER 25 YEARS
0.6/ 100
METRIC RATING
248th/ 347
METRIC RANK
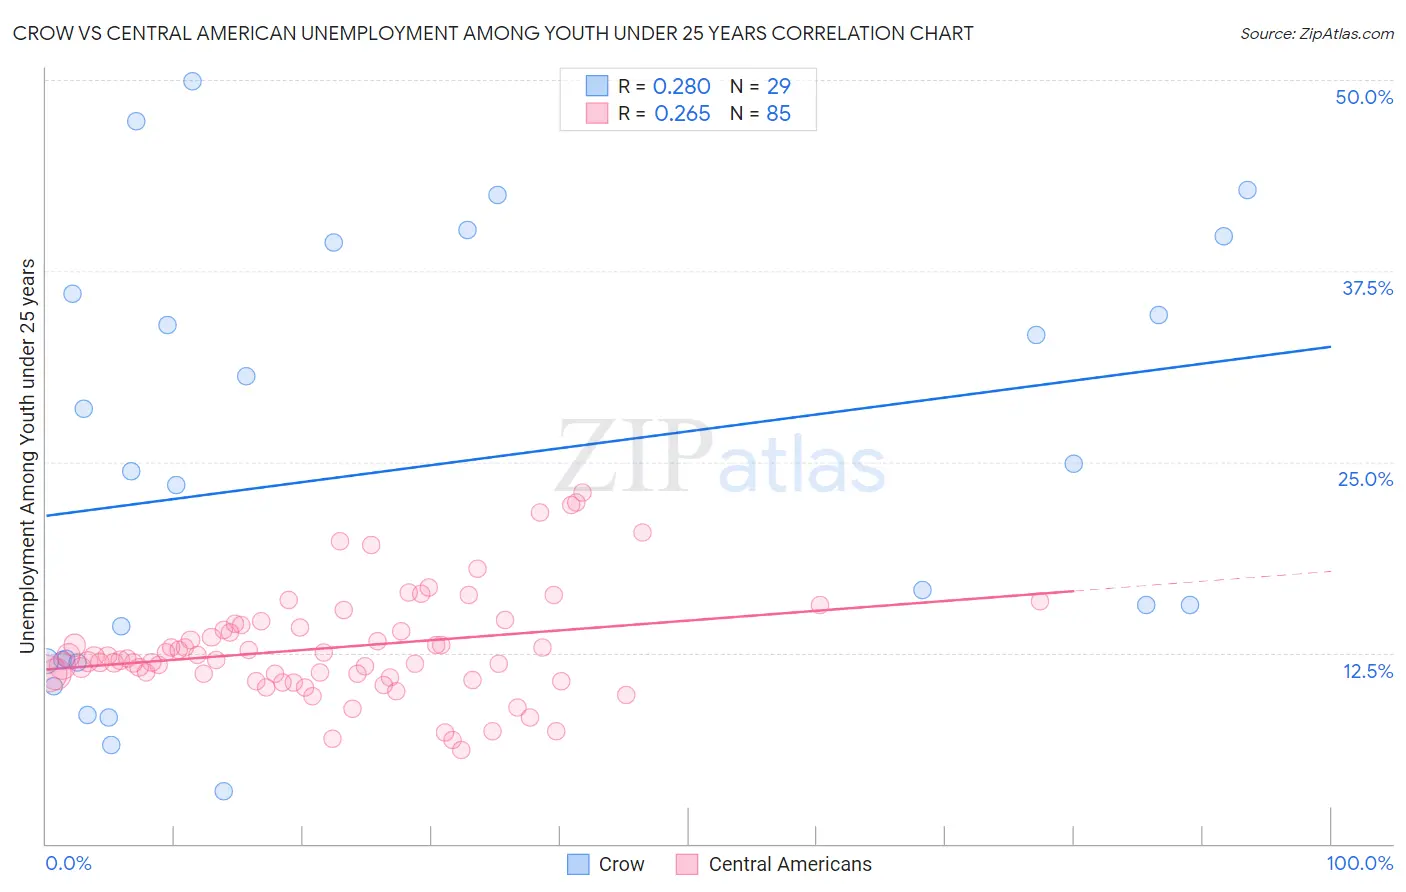
Crow vs Central American Unemployment Among Youth under 25 years Correlation Chart
The statistical analysis conducted on geographies consisting of 58,938,445 people shows a weak positive correlation between the proportion of Crow and unemployment rate among youth under the age of 25 in the United States with a correlation coefficient (R) of 0.280 and weighted average of 20.1%. Similarly, the statistical analysis conducted on geographies consisting of 494,331,581 people shows a weak positive correlation between the proportion of Central Americans and unemployment rate among youth under the age of 25 in the United States with a correlation coefficient (R) of 0.265 and weighted average of 12.2%, a difference of 64.2%.
Unemployment Among Youth under 25 years Correlation Summary
| Measurement | Crow | Central American |
| Minimum | 3.4% | 6.2% |
| Maximum | 49.9% | 23.0% |
| Range | 46.5% | 16.8% |
| Mean | 24.8% | 12.8% |
| Median | 24.4% | 12.1% |
| Interquartile 25% (IQ1) | 12.0% | 11.0% |
| Interquartile 75% (IQ3) | 37.7% | 14.2% |
| Interquartile Range (IQR) | 25.7% | 3.3% |
| Standard Deviation (Sample) | 13.9% | 3.5% |
| Standard Deviation (Population) | 13.7% | 3.5% |
Similar Demographics by Unemployment Among Youth under 25 years
Demographics Similar to Crow by Unemployment Among Youth under 25 years
In terms of unemployment among youth under 25 years, the demographic groups most similar to Crow are Hopi (21.5%, a difference of 7.0%), Navajo (18.6%, a difference of 7.8%), Puerto Rican (18.4%, a difference of 9.0%), Inupiat (22.0%, a difference of 9.6%), and Paiute (17.6%, a difference of 14.3%).
| Demographics | Rating | Rank | Unemployment Among Youth under 25 years |
| Guyanese | 0.0 /100 | #333 | Tragic 15.9% |
| Immigrants | Guyana | 0.0 /100 | #334 | Tragic 15.9% |
| Immigrants | St. Vincent and the Grenadines | 0.0 /100 | #335 | Tragic 16.1% |
| Pima | 0.0 /100 | #336 | Tragic 16.2% |
| Arapaho | 0.0 /100 | #337 | Tragic 16.3% |
| Yuman | 0.0 /100 | #338 | Tragic 16.3% |
| Tsimshian | 0.0 /100 | #339 | Tragic 16.5% |
| Colville | 0.0 /100 | #340 | Tragic 16.8% |
| Paiute | 0.0 /100 | #341 | Tragic 17.6% |
| Puerto Ricans | 0.0 /100 | #342 | Tragic 18.4% |
| Navajo | 0.0 /100 | #343 | Tragic 18.6% |
| Crow | 0.0 /100 | #344 | Tragic 20.1% |
| Hopi | 0.0 /100 | #345 | Tragic 21.5% |
| Inupiat | 0.0 /100 | #346 | Tragic 22.0% |
| Yup'ik | 0.0 /100 | #347 | Tragic 23.7% |
Demographics Similar to Central Americans by Unemployment Among Youth under 25 years
In terms of unemployment among youth under 25 years, the demographic groups most similar to Central Americans are Immigrants from Greece (12.2%, a difference of 0.010%), Soviet Union (12.2%, a difference of 0.010%), Immigrants from Honduras (12.2%, a difference of 0.12%), Spanish American (12.2%, a difference of 0.13%), and Immigrants from the Azores (12.2%, a difference of 0.14%).
| Demographics | Rating | Rank | Unemployment Among Youth under 25 years |
| Immigrants | Albania | 1.1 /100 | #241 | Tragic 12.1% |
| Immigrants | Western Asia | 0.8 /100 | #242 | Tragic 12.2% |
| Immigrants | Azores | 0.6 /100 | #243 | Tragic 12.2% |
| Alaskan Athabascans | 0.6 /100 | #244 | Tragic 12.2% |
| Spanish Americans | 0.6 /100 | #245 | Tragic 12.2% |
| Immigrants | Honduras | 0.6 /100 | #246 | Tragic 12.2% |
| Immigrants | Greece | 0.6 /100 | #247 | Tragic 12.2% |
| Central Americans | 0.6 /100 | #248 | Tragic 12.2% |
| Soviet Union | 0.6 /100 | #249 | Tragic 12.2% |
| Delaware | 0.4 /100 | #250 | Tragic 12.3% |
| Mexican American Indians | 0.4 /100 | #251 | Tragic 12.3% |
| Immigrants | Syria | 0.3 /100 | #252 | Tragic 12.3% |
| Mexicans | 0.3 /100 | #253 | Tragic 12.3% |
| Hondurans | 0.3 /100 | #254 | Tragic 12.3% |
| Hispanics or Latinos | 0.2 /100 | #255 | Tragic 12.4% |