Croatian vs Scottish Unemployment Among Youth under 25 years
COMPARE
Croatian
Scottish
Unemployment Among Youth under 25 years
Unemployment Among Youth under 25 years Comparison
Croatians
Scottish
10.9%
UNEMPLOYMENT AMONG YOUTH UNDER 25 YEARS
99.8/ 100
METRIC RATING
41st/ 347
METRIC RANK
10.9%
UNEMPLOYMENT AMONG YOUTH UNDER 25 YEARS
99.8/ 100
METRIC RATING
40th/ 347
METRIC RANK
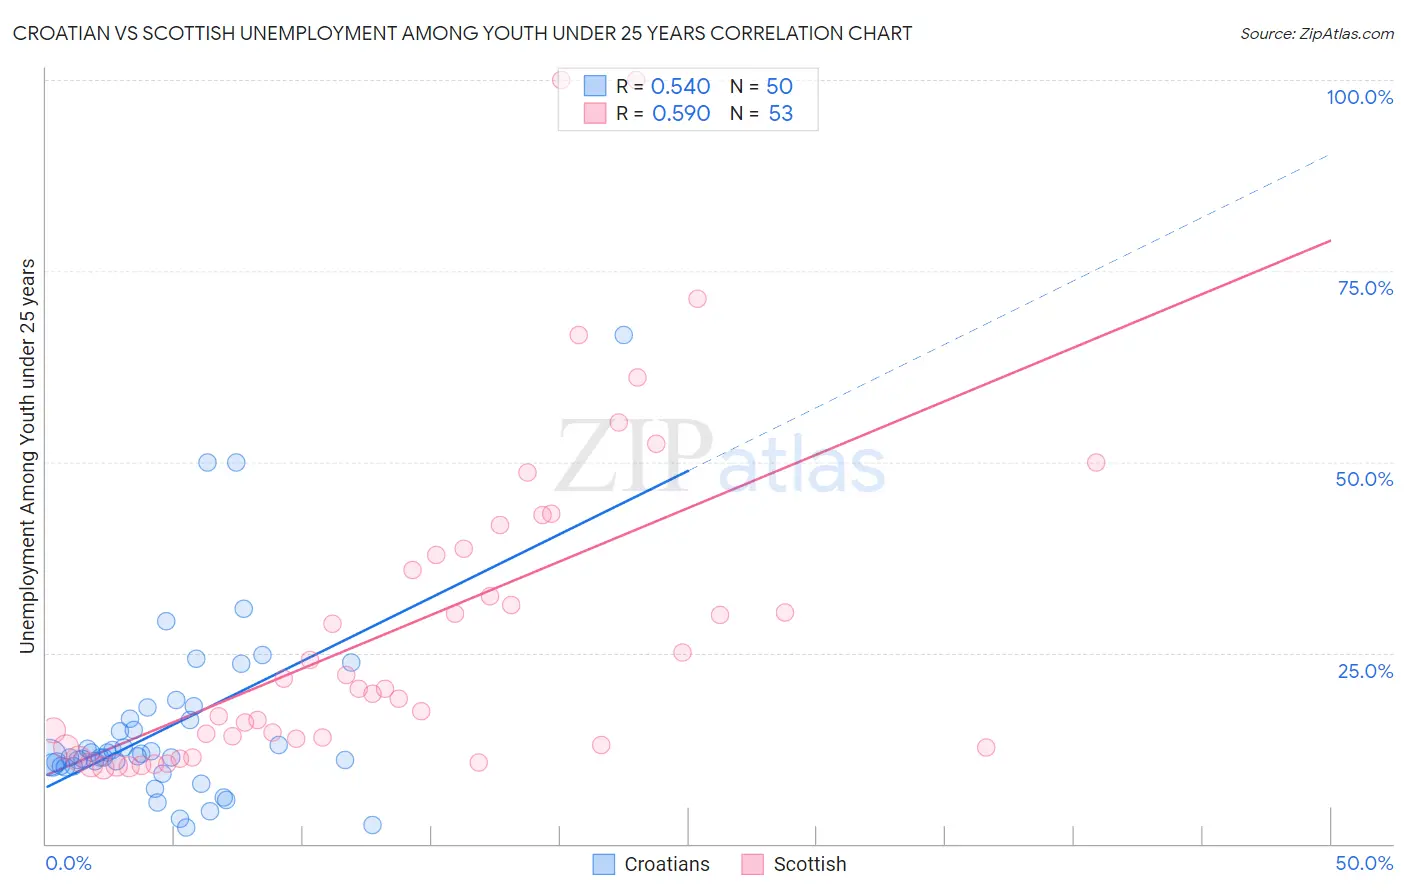
Croatian vs Scottish Unemployment Among Youth under 25 years Correlation Chart
The statistical analysis conducted on geographies consisting of 370,295,729 people shows a substantial positive correlation between the proportion of Croatians and unemployment rate among youth under the age of 25 in the United States with a correlation coefficient (R) of 0.540 and weighted average of 10.9%. Similarly, the statistical analysis conducted on geographies consisting of 542,532,061 people shows a substantial positive correlation between the proportion of Scottish and unemployment rate among youth under the age of 25 in the United States with a correlation coefficient (R) of 0.590 and weighted average of 10.9%, a difference of 0.10%.
Unemployment Among Youth under 25 years Correlation Summary
| Measurement | Croatian | Scottish |
| Minimum | 2.1% | 9.9% |
| Maximum | 66.6% | 100.0% |
| Range | 64.5% | 90.1% |
| Mean | 15.3% | 28.4% |
| Median | 11.4% | 20.3% |
| Interquartile 25% (IQ1) | 10.2% | 12.8% |
| Interquartile 75% (IQ3) | 16.4% | 38.2% |
| Interquartile Range (IQR) | 6.2% | 25.5% |
| Standard Deviation (Sample) | 12.1% | 21.5% |
| Standard Deviation (Population) | 12.0% | 21.3% |
Demographics Similar to Croatians and Scottish by Unemployment Among Youth under 25 years
In terms of unemployment among youth under 25 years, the demographic groups most similar to Croatians are Cambodian (10.9%, a difference of 0.070%), Immigrants from Zaire (10.9%, a difference of 0.25%), Immigrants from Congo (10.9%, a difference of 0.27%), British (10.9%, a difference of 0.33%), and Immigrants from Zimbabwe (10.8%, a difference of 0.34%). Similarly, the demographic groups most similar to Scottish are Immigrants from Zaire (10.9%, a difference of 0.16%), Immigrants from Congo (10.9%, a difference of 0.17%), Cambodian (10.9%, a difference of 0.17%), Immigrants from Zimbabwe (10.8%, a difference of 0.24%), and Hmong (10.8%, a difference of 0.40%).
| Demographics | Rating | Rank | Unemployment Among Youth under 25 years |
| Osage | 99.9 /100 | #30 | Exceptional 10.7% |
| Slovenes | 99.9 /100 | #31 | Exceptional 10.7% |
| Taiwanese | 99.9 /100 | #32 | Exceptional 10.8% |
| Europeans | 99.9 /100 | #33 | Exceptional 10.8% |
| English | 99.9 /100 | #34 | Exceptional 10.8% |
| Immigrants | Nepal | 99.9 /100 | #35 | Exceptional 10.8% |
| Hmong | 99.8 /100 | #36 | Exceptional 10.8% |
| Immigrants | Zimbabwe | 99.8 /100 | #37 | Exceptional 10.8% |
| Immigrants | Congo | 99.8 /100 | #38 | Exceptional 10.9% |
| Immigrants | Zaire | 99.8 /100 | #39 | Exceptional 10.9% |
| Scottish | 99.8 /100 | #40 | Exceptional 10.9% |
| Croatians | 99.8 /100 | #41 | Exceptional 10.9% |
| Cambodians | 99.7 /100 | #42 | Exceptional 10.9% |
| British | 99.7 /100 | #43 | Exceptional 10.9% |
| Welsh | 99.7 /100 | #44 | Exceptional 10.9% |
| Bulgarians | 99.6 /100 | #45 | Exceptional 10.9% |
| Tongans | 99.6 /100 | #46 | Exceptional 10.9% |
| Australians | 99.6 /100 | #47 | Exceptional 10.9% |
| Poles | 99.3 /100 | #48 | Exceptional 11.0% |
| Thais | 99.3 /100 | #49 | Exceptional 11.0% |
| Czechoslovakians | 99.2 /100 | #50 | Exceptional 11.0% |