Crow vs American Unemployment Among Youth under 25 years
COMPARE
Crow
American
Unemployment Among Youth under 25 years
Unemployment Among Youth under 25 years Comparison
Crow
Americans
20.1%
UNEMPLOYMENT AMONG YOUTH UNDER 25 YEARS
0.0/ 100
METRIC RATING
344th/ 347
METRIC RANK
11.7%
UNEMPLOYMENT AMONG YOUTH UNDER 25 YEARS
34.5/ 100
METRIC RATING
183rd/ 347
METRIC RANK
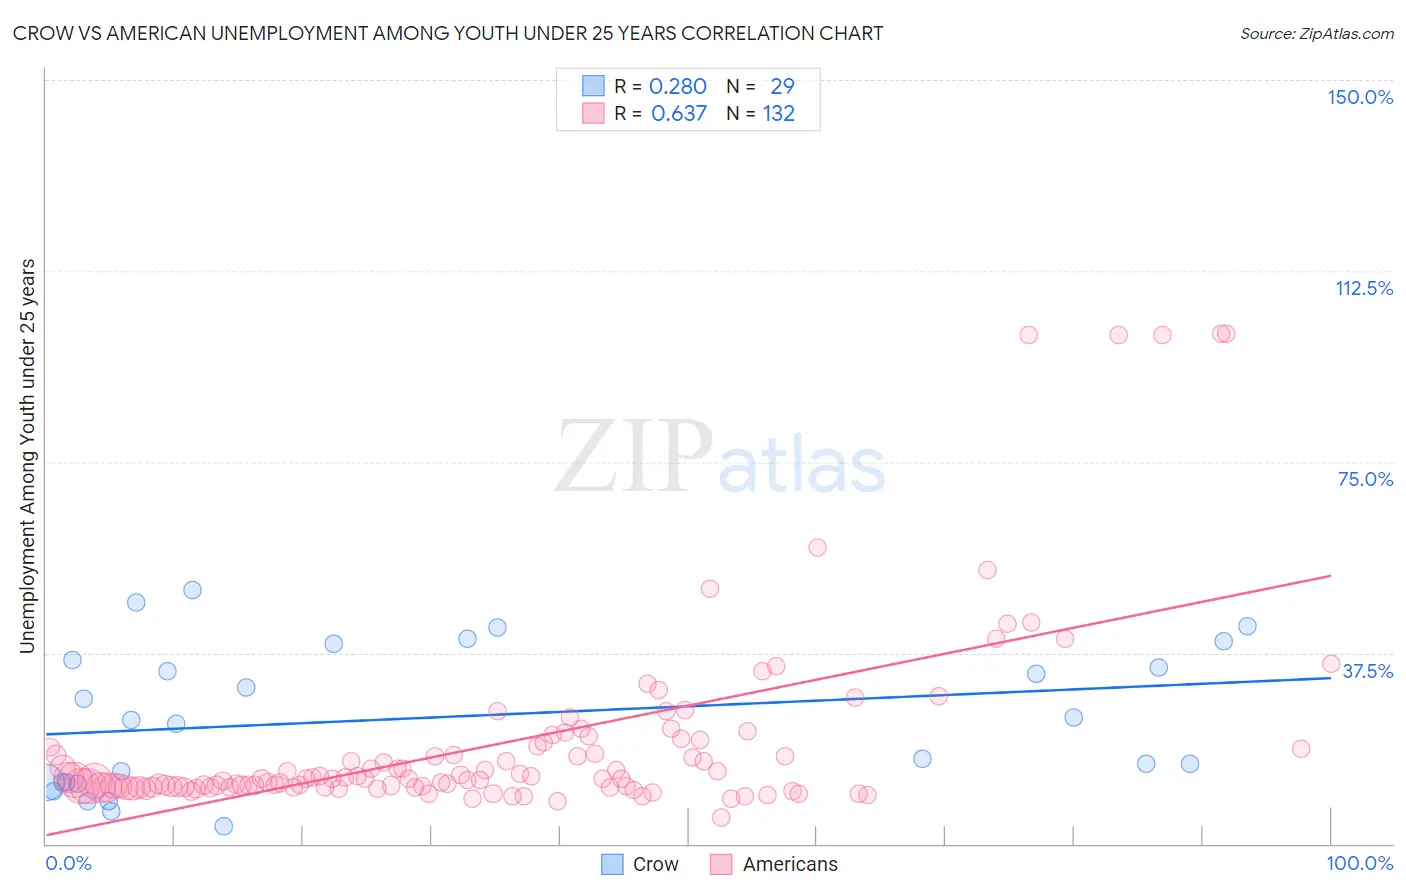
Crow vs American Unemployment Among Youth under 25 years Correlation Chart
The statistical analysis conducted on geographies consisting of 58,938,445 people shows a weak positive correlation between the proportion of Crow and unemployment rate among youth under the age of 25 in the United States with a correlation coefficient (R) of 0.280 and weighted average of 20.1%. Similarly, the statistical analysis conducted on geographies consisting of 554,335,703 people shows a significant positive correlation between the proportion of Americans and unemployment rate among youth under the age of 25 in the United States with a correlation coefficient (R) of 0.637 and weighted average of 11.7%, a difference of 71.8%.
Unemployment Among Youth under 25 years Correlation Summary
| Measurement | Crow | American |
| Minimum | 3.4% | 5.1% |
| Maximum | 49.9% | 100.1% |
| Range | 46.5% | 95.0% |
| Mean | 24.8% | 19.6% |
| Median | 24.4% | 12.8% |
| Interquartile 25% (IQ1) | 12.0% | 11.1% |
| Interquartile 75% (IQ3) | 37.7% | 19.1% |
| Interquartile Range (IQR) | 25.7% | 8.0% |
| Standard Deviation (Sample) | 13.9% | 18.5% |
| Standard Deviation (Population) | 13.7% | 18.5% |
Similar Demographics by Unemployment Among Youth under 25 years
Demographics Similar to Crow by Unemployment Among Youth under 25 years
In terms of unemployment among youth under 25 years, the demographic groups most similar to Crow are Hopi (21.5%, a difference of 7.0%), Navajo (18.6%, a difference of 7.8%), Puerto Rican (18.4%, a difference of 9.0%), Inupiat (22.0%, a difference of 9.6%), and Paiute (17.6%, a difference of 14.3%).
| Demographics | Rating | Rank | Unemployment Among Youth under 25 years |
| Guyanese | 0.0 /100 | #333 | Tragic 15.9% |
| Immigrants | Guyana | 0.0 /100 | #334 | Tragic 15.9% |
| Immigrants | St. Vincent and the Grenadines | 0.0 /100 | #335 | Tragic 16.1% |
| Pima | 0.0 /100 | #336 | Tragic 16.2% |
| Arapaho | 0.0 /100 | #337 | Tragic 16.3% |
| Yuman | 0.0 /100 | #338 | Tragic 16.3% |
| Tsimshian | 0.0 /100 | #339 | Tragic 16.5% |
| Colville | 0.0 /100 | #340 | Tragic 16.8% |
| Paiute | 0.0 /100 | #341 | Tragic 17.6% |
| Puerto Ricans | 0.0 /100 | #342 | Tragic 18.4% |
| Navajo | 0.0 /100 | #343 | Tragic 18.6% |
| Crow | 0.0 /100 | #344 | Tragic 20.1% |
| Hopi | 0.0 /100 | #345 | Tragic 21.5% |
| Inupiat | 0.0 /100 | #346 | Tragic 22.0% |
| Yup'ik | 0.0 /100 | #347 | Tragic 23.7% |
Demographics Similar to Americans by Unemployment Among Youth under 25 years
In terms of unemployment among youth under 25 years, the demographic groups most similar to Americans are Immigrants from Eastern Europe (11.7%, a difference of 0.010%), French American Indian (11.7%, a difference of 0.020%), Maltese (11.7%, a difference of 0.030%), Immigrants from Italy (11.7%, a difference of 0.080%), and Immigrants from Egypt (11.7%, a difference of 0.12%).
| Demographics | Rating | Rank | Unemployment Among Youth under 25 years |
| Ugandans | 45.6 /100 | #176 | Average 11.6% |
| Immigrants | Denmark | 45.0 /100 | #177 | Average 11.6% |
| Immigrants | Europe | 42.4 /100 | #178 | Average 11.6% |
| Immigrants | Hong Kong | 42.4 /100 | #179 | Average 11.6% |
| Spaniards | 39.8 /100 | #180 | Fair 11.7% |
| Syrians | 38.4 /100 | #181 | Fair 11.7% |
| Immigrants | Italy | 36.2 /100 | #182 | Fair 11.7% |
| Americans | 34.5 /100 | #183 | Fair 11.7% |
| Immigrants | Eastern Europe | 34.1 /100 | #184 | Fair 11.7% |
| French American Indians | 34.0 /100 | #185 | Fair 11.7% |
| Maltese | 33.9 /100 | #186 | Fair 11.7% |
| Immigrants | Egypt | 31.9 /100 | #187 | Fair 11.7% |
| Immigrants | Poland | 31.4 /100 | #188 | Fair 11.7% |
| Japanese | 30.8 /100 | #189 | Fair 11.7% |
| Portuguese | 30.3 /100 | #190 | Fair 11.7% |