Crow vs Immigrants from Egypt Unemployment Among Seniors over 75 years
COMPARE
Crow
Immigrants from Egypt
Unemployment Among Seniors over 75 years
Unemployment Among Seniors over 75 years Comparison
Crow
Immigrants from Egypt
5.9%
UNEMPLOYMENT AMONG SENIORS OVER 75 YEARS
100.0/ 100
METRIC RATING
1st/ 347
METRIC RANK
7.9%
UNEMPLOYMENT AMONG SENIORS OVER 75 YEARS
100.0/ 100
METRIC RATING
53rd/ 347
METRIC RANK
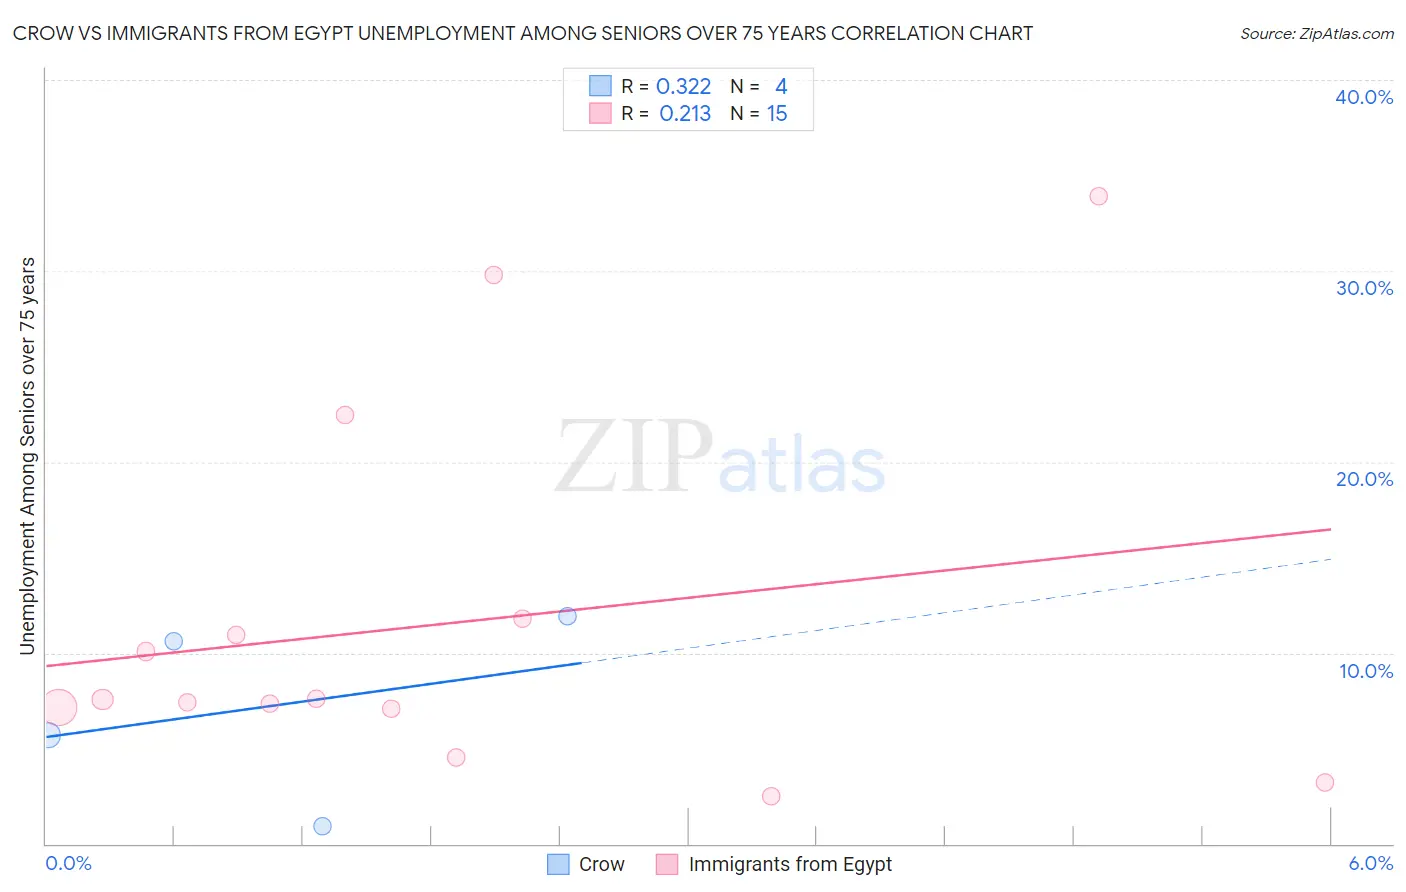
Crow vs Immigrants from Egypt Unemployment Among Seniors over 75 years Correlation Chart
The statistical analysis conducted on geographies consisting of 45,464,482 people shows a mild positive correlation between the proportion of Crow and unemployment rate among seniors over the age of 75 in the United States with a correlation coefficient (R) of 0.322 and weighted average of 5.9%. Similarly, the statistical analysis conducted on geographies consisting of 152,094,577 people shows a weak positive correlation between the proportion of Immigrants from Egypt and unemployment rate among seniors over the age of 75 in the United States with a correlation coefficient (R) of 0.213 and weighted average of 7.9%, a difference of 32.9%.
Unemployment Among Seniors over 75 years Correlation Summary
| Measurement | Crow | Immigrants from Egypt |
| Minimum | 0.90% | 2.5% |
| Maximum | 11.9% | 33.9% |
| Range | 11.0% | 31.4% |
| Mean | 7.3% | 11.5% |
| Median | 8.1% | 7.6% |
| Interquartile 25% (IQ1) | 3.3% | 7.1% |
| Interquartile 75% (IQ3) | 11.3% | 11.8% |
| Interquartile Range (IQR) | 8.0% | 4.7% |
| Standard Deviation (Sample) | 5.0% | 9.5% |
| Standard Deviation (Population) | 4.4% | 9.2% |
Similar Demographics by Unemployment Among Seniors over 75 years
Demographics Similar to Crow by Unemployment Among Seniors over 75 years
In terms of unemployment among seniors over 75 years, the demographic groups most similar to Crow are Chinese (5.9%, a difference of 0.010%), Cheyenne (5.9%, a difference of 0.56%), Alsatian (6.1%, a difference of 3.5%), Hopi (6.3%, a difference of 6.1%), and Immigrants from Armenia (6.5%, a difference of 10.2%).
| Demographics | Rating | Rank | Unemployment Among Seniors over 75 years |
| Crow | 100.0 /100 | #1 | Exceptional 5.9% |
| Chinese | 100.0 /100 | #2 | Exceptional 5.9% |
| Cheyenne | 100.0 /100 | #3 | Exceptional 5.9% |
| Alsatians | 100.0 /100 | #4 | Exceptional 6.1% |
| Hopi | 100.0 /100 | #5 | Exceptional 6.3% |
| Immigrants | Armenia | 100.0 /100 | #6 | Exceptional 6.5% |
| Spanish American Indians | 100.0 /100 | #7 | Exceptional 6.5% |
| Taiwanese | 100.0 /100 | #8 | Exceptional 6.6% |
| Soviet Union | 100.0 /100 | #9 | Exceptional 6.6% |
| Yuman | 100.0 /100 | #10 | Exceptional 6.7% |
| Immigrants | Grenada | 100.0 /100 | #11 | Exceptional 6.7% |
| Comanche | 100.0 /100 | #12 | Exceptional 6.7% |
| Immigrants | Congo | 100.0 /100 | #13 | Exceptional 6.7% |
| Ute | 100.0 /100 | #14 | Exceptional 6.8% |
| Icelanders | 100.0 /100 | #15 | Exceptional 7.0% |
Demographics Similar to Immigrants from Egypt by Unemployment Among Seniors over 75 years
In terms of unemployment among seniors over 75 years, the demographic groups most similar to Immigrants from Egypt are Immigrants from Malaysia (7.9%, a difference of 0.040%), Bahamian (7.8%, a difference of 0.070%), Moroccan (7.8%, a difference of 0.31%), Immigrants from Latvia (7.8%, a difference of 0.36%), and Filipino (7.9%, a difference of 0.36%).
| Demographics | Rating | Rank | Unemployment Among Seniors over 75 years |
| Immigrants | China | 100.0 /100 | #46 | Exceptional 7.8% |
| Creek | 100.0 /100 | #47 | Exceptional 7.8% |
| Immigrants | Chile | 100.0 /100 | #48 | Exceptional 7.8% |
| Potawatomi | 100.0 /100 | #49 | Exceptional 7.8% |
| Immigrants | Latvia | 100.0 /100 | #50 | Exceptional 7.8% |
| Moroccans | 100.0 /100 | #51 | Exceptional 7.8% |
| Bahamians | 100.0 /100 | #52 | Exceptional 7.8% |
| Immigrants | Egypt | 100.0 /100 | #53 | Exceptional 7.9% |
| Immigrants | Malaysia | 99.9 /100 | #54 | Exceptional 7.9% |
| Filipinos | 99.9 /100 | #55 | Exceptional 7.9% |
| Immigrants | Eastern Asia | 99.9 /100 | #56 | Exceptional 7.9% |
| Ottawa | 99.9 /100 | #57 | Exceptional 7.9% |
| Iranians | 99.9 /100 | #58 | Exceptional 7.9% |
| Indonesians | 99.9 /100 | #59 | Exceptional 7.9% |
| Immigrants | Morocco | 99.9 /100 | #60 | Exceptional 7.9% |