Korean vs Chilean Unemployment Among Seniors over 75 years
COMPARE
Korean
Chilean
Unemployment Among Seniors over 75 years
Unemployment Among Seniors over 75 years Comparison
Koreans
Chileans
8.9%
UNEMPLOYMENT AMONG SENIORS OVER 75 YEARS
21.9/ 100
METRIC RATING
205th/ 347
METRIC RANK
8.4%
UNEMPLOYMENT AMONG SENIORS OVER 75 YEARS
93.8/ 100
METRIC RATING
132nd/ 347
METRIC RANK
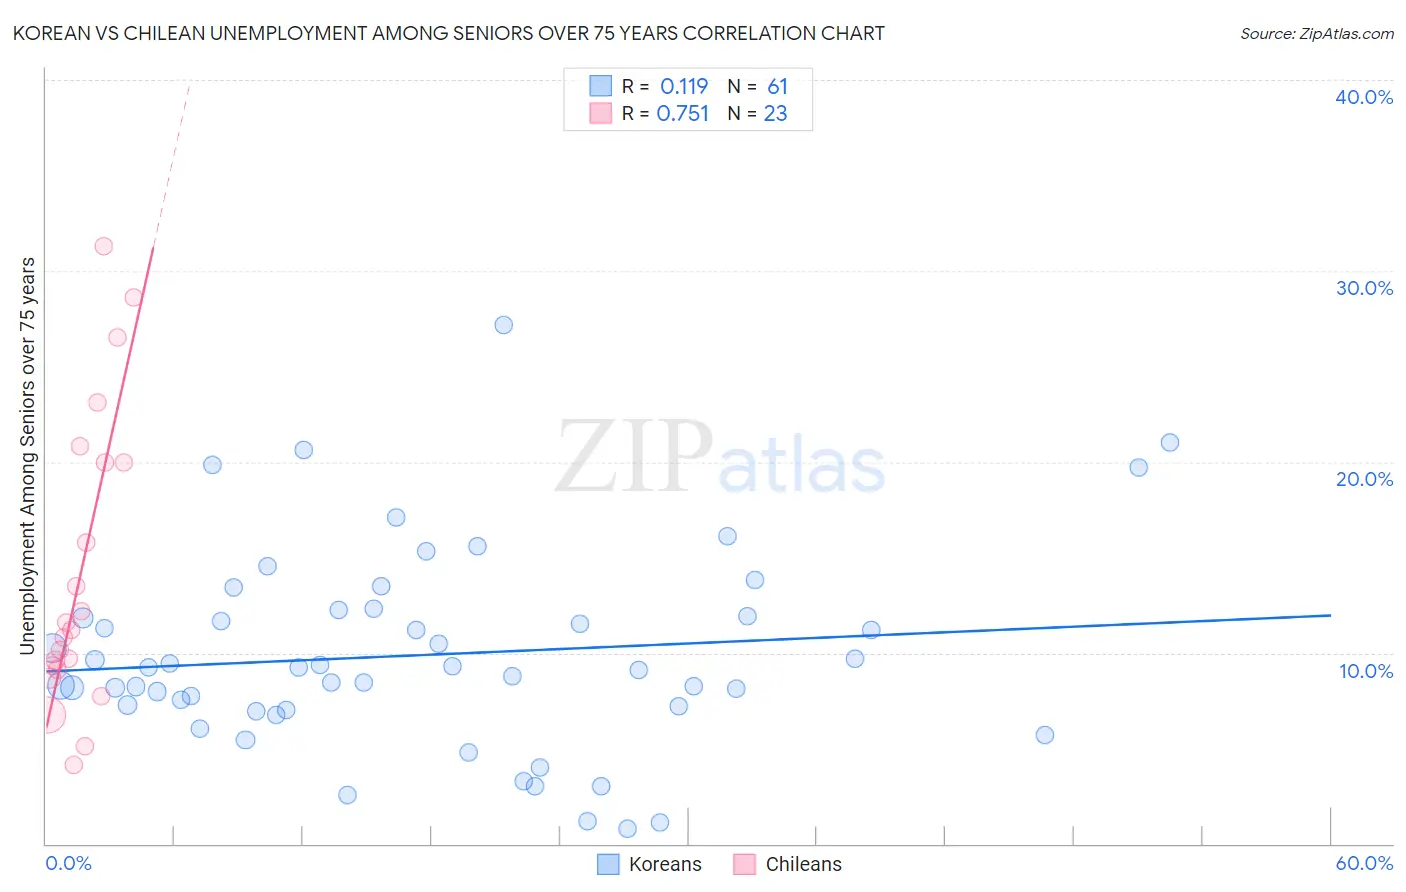
Korean vs Chilean Unemployment Among Seniors over 75 years Correlation Chart
The statistical analysis conducted on geographies consisting of 228,730,103 people shows a poor positive correlation between the proportion of Koreans and unemployment rate among seniors over the age of 75 in the United States with a correlation coefficient (R) of 0.119 and weighted average of 8.9%. Similarly, the statistical analysis conducted on geographies consisting of 155,927,496 people shows a strong positive correlation between the proportion of Chileans and unemployment rate among seniors over the age of 75 in the United States with a correlation coefficient (R) of 0.751 and weighted average of 8.4%, a difference of 5.6%.
Unemployment Among Seniors over 75 years Correlation Summary
| Measurement | Korean | Chilean |
| Minimum | 0.80% | 4.1% |
| Maximum | 27.2% | 31.3% |
| Range | 26.4% | 27.2% |
| Mean | 9.9% | 14.2% |
| Median | 9.2% | 11.2% |
| Interquartile 25% (IQ1) | 7.1% | 9.1% |
| Interquartile 75% (IQ3) | 12.1% | 20.0% |
| Interquartile Range (IQR) | 5.0% | 10.9% |
| Standard Deviation (Sample) | 5.2% | 7.7% |
| Standard Deviation (Population) | 5.1% | 7.5% |
Similar Demographics by Unemployment Among Seniors over 75 years
Demographics Similar to Koreans by Unemployment Among Seniors over 75 years
In terms of unemployment among seniors over 75 years, the demographic groups most similar to Koreans are Spaniard (8.9%, a difference of 0.010%), Immigrants from Northern Europe (8.9%, a difference of 0.15%), Russian (8.9%, a difference of 0.17%), Immigrants from Peru (8.9%, a difference of 0.18%), and Pakistani (8.9%, a difference of 0.26%).
| Demographics | Rating | Rank | Unemployment Among Seniors over 75 years |
| Eastern Europeans | 25.9 /100 | #198 | Fair 8.9% |
| Pakistanis | 25.4 /100 | #199 | Fair 8.9% |
| Osage | 25.4 /100 | #200 | Fair 8.9% |
| Immigrants | Peru | 24.3 /100 | #201 | Fair 8.9% |
| Russians | 24.1 /100 | #202 | Fair 8.9% |
| Immigrants | Northern Europe | 23.9 /100 | #203 | Fair 8.9% |
| Spaniards | 22.0 /100 | #204 | Fair 8.9% |
| Koreans | 21.9 /100 | #205 | Fair 8.9% |
| Immigrants | Western Europe | 18.2 /100 | #206 | Poor 8.9% |
| Malaysians | 16.3 /100 | #207 | Poor 8.9% |
| Immigrants | Philippines | 15.8 /100 | #208 | Poor 8.9% |
| Salvadorans | 15.4 /100 | #209 | Poor 8.9% |
| Bermudans | 15.0 /100 | #210 | Poor 8.9% |
| Delaware | 14.6 /100 | #211 | Poor 9.0% |
| Romanians | 13.8 /100 | #212 | Poor 9.0% |
Demographics Similar to Chileans by Unemployment Among Seniors over 75 years
In terms of unemployment among seniors over 75 years, the demographic groups most similar to Chileans are Serbian (8.4%, a difference of 0.030%), Immigrants from Czechoslovakia (8.4%, a difference of 0.11%), German Russian (8.4%, a difference of 0.28%), Apache (8.4%, a difference of 0.37%), and Haitian (8.5%, a difference of 0.50%).
| Demographics | Rating | Rank | Unemployment Among Seniors over 75 years |
| Immigrants | Moldova | 96.7 /100 | #125 | Exceptional 8.3% |
| Belizeans | 96.3 /100 | #126 | Exceptional 8.4% |
| Hondurans | 96.2 /100 | #127 | Exceptional 8.4% |
| Native Hawaiians | 96.1 /100 | #128 | Exceptional 8.4% |
| Ghanaians | 96.0 /100 | #129 | Exceptional 8.4% |
| Apache | 95.2 /100 | #130 | Exceptional 8.4% |
| German Russians | 94.9 /100 | #131 | Exceptional 8.4% |
| Chileans | 93.8 /100 | #132 | Exceptional 8.4% |
| Serbians | 93.7 /100 | #133 | Exceptional 8.4% |
| Immigrants | Czechoslovakia | 93.4 /100 | #134 | Exceptional 8.4% |
| Haitians | 91.4 /100 | #135 | Exceptional 8.5% |
| Immigrants | Trinidad and Tobago | 90.8 /100 | #136 | Exceptional 8.5% |
| Immigrants | Kuwait | 90.5 /100 | #137 | Exceptional 8.5% |
| Immigrants | Bulgaria | 89.6 /100 | #138 | Excellent 8.5% |
| Barbadians | 88.6 /100 | #139 | Excellent 8.5% |