Crow vs Panamanian Unemployment Among Seniors over 75 years
COMPARE
Crow
Panamanian
Unemployment Among Seniors over 75 years
Unemployment Among Seniors over 75 years Comparison
Crow
Panamanians
5.9%
UNEMPLOYMENT AMONG SENIORS OVER 75 YEARS
100.0/ 100
METRIC RATING
1st/ 347
METRIC RANK
9.1%
UNEMPLOYMENT AMONG SENIORS OVER 75 YEARS
4.0/ 100
METRIC RATING
235th/ 347
METRIC RANK
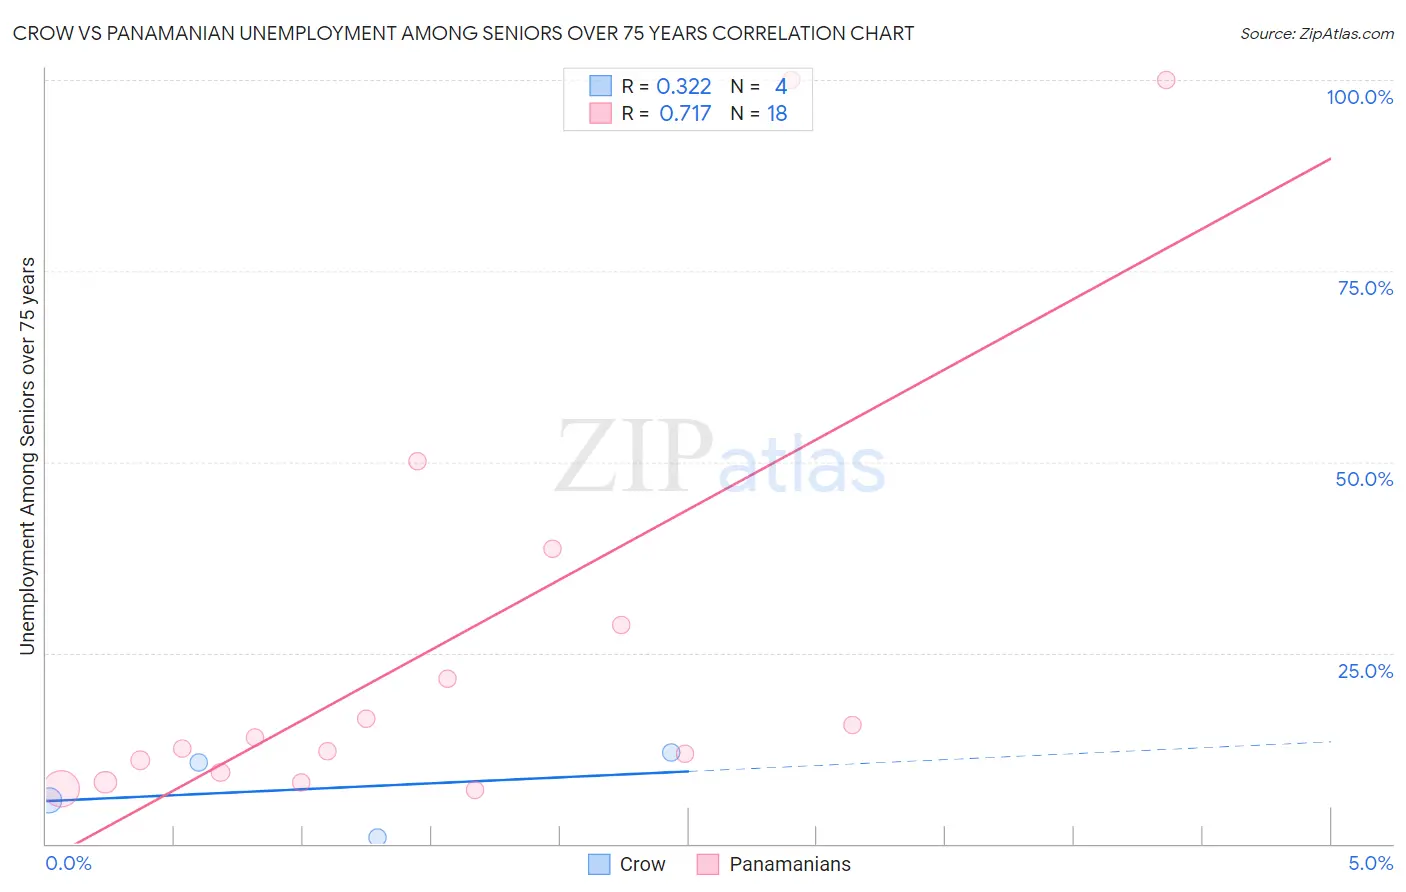
Crow vs Panamanian Unemployment Among Seniors over 75 years Correlation Chart
The statistical analysis conducted on geographies consisting of 45,464,482 people shows a mild positive correlation between the proportion of Crow and unemployment rate among seniors over the age of 75 in the United States with a correlation coefficient (R) of 0.322 and weighted average of 5.9%. Similarly, the statistical analysis conducted on geographies consisting of 160,542,886 people shows a strong positive correlation between the proportion of Panamanians and unemployment rate among seniors over the age of 75 in the United States with a correlation coefficient (R) of 0.717 and weighted average of 9.1%, a difference of 54.3%.
Unemployment Among Seniors over 75 years Correlation Summary
| Measurement | Crow | Panamanian |
| Minimum | 0.90% | 7.1% |
| Maximum | 11.9% | 100.0% |
| Range | 11.0% | 92.9% |
| Mean | 7.3% | 26.2% |
| Median | 8.1% | 13.2% |
| Interquartile 25% (IQ1) | 3.3% | 9.4% |
| Interquartile 75% (IQ3) | 11.3% | 28.6% |
| Interquartile Range (IQR) | 8.0% | 19.2% |
| Standard Deviation (Sample) | 5.0% | 29.2% |
| Standard Deviation (Population) | 4.4% | 28.4% |
Similar Demographics by Unemployment Among Seniors over 75 years
Demographics Similar to Crow by Unemployment Among Seniors over 75 years
In terms of unemployment among seniors over 75 years, the demographic groups most similar to Crow are Chinese (5.9%, a difference of 0.010%), Cheyenne (5.9%, a difference of 0.56%), Alsatian (6.1%, a difference of 3.5%), Hopi (6.3%, a difference of 6.1%), and Immigrants from Armenia (6.5%, a difference of 10.2%).
| Demographics | Rating | Rank | Unemployment Among Seniors over 75 years |
| Crow | 100.0 /100 | #1 | Exceptional 5.9% |
| Chinese | 100.0 /100 | #2 | Exceptional 5.9% |
| Cheyenne | 100.0 /100 | #3 | Exceptional 5.9% |
| Alsatians | 100.0 /100 | #4 | Exceptional 6.1% |
| Hopi | 100.0 /100 | #5 | Exceptional 6.3% |
| Immigrants | Armenia | 100.0 /100 | #6 | Exceptional 6.5% |
| Spanish American Indians | 100.0 /100 | #7 | Exceptional 6.5% |
| Taiwanese | 100.0 /100 | #8 | Exceptional 6.6% |
| Soviet Union | 100.0 /100 | #9 | Exceptional 6.6% |
| Yuman | 100.0 /100 | #10 | Exceptional 6.7% |
| Immigrants | Grenada | 100.0 /100 | #11 | Exceptional 6.7% |
| Comanche | 100.0 /100 | #12 | Exceptional 6.7% |
| Immigrants | Congo | 100.0 /100 | #13 | Exceptional 6.7% |
| Ute | 100.0 /100 | #14 | Exceptional 6.8% |
| Icelanders | 100.0 /100 | #15 | Exceptional 7.0% |
Demographics Similar to Panamanians by Unemployment Among Seniors over 75 years
In terms of unemployment among seniors over 75 years, the demographic groups most similar to Panamanians are Jordanian (9.1%, a difference of 0.010%), Houma (9.1%, a difference of 0.040%), Inupiat (9.1%, a difference of 0.14%), Vietnamese (9.1%, a difference of 0.19%), and Mexican (9.1%, a difference of 0.20%).
| Demographics | Rating | Rank | Unemployment Among Seniors over 75 years |
| Kenyans | 5.4 /100 | #228 | Tragic 9.1% |
| Hispanics or Latinos | 5.0 /100 | #229 | Tragic 9.1% |
| Northern Europeans | 4.9 /100 | #230 | Tragic 9.1% |
| Immigrants | Central America | 4.9 /100 | #231 | Tragic 9.1% |
| Africans | 4.9 /100 | #232 | Tragic 9.1% |
| Yugoslavians | 4.8 /100 | #233 | Tragic 9.1% |
| Vietnamese | 4.6 /100 | #234 | Tragic 9.1% |
| Panamanians | 4.0 /100 | #235 | Tragic 9.1% |
| Jordanians | 4.0 /100 | #236 | Tragic 9.1% |
| Houma | 3.9 /100 | #237 | Tragic 9.1% |
| Inupiat | 3.6 /100 | #238 | Tragic 9.1% |
| Mexicans | 3.5 /100 | #239 | Tragic 9.1% |
| Spanish | 3.3 /100 | #240 | Tragic 9.1% |
| Immigrants | Southern Europe | 2.8 /100 | #241 | Tragic 9.2% |
| Sierra Leoneans | 2.8 /100 | #242 | Tragic 9.2% |