Croatian vs Ugandan Male Unemployment
COMPARE
Croatian
Ugandan
Male Unemployment
Male Unemployment Comparison
Croatians
Ugandans
4.9%
MALE UNEMPLOYMENT
98.9/ 100
METRIC RATING
50th/ 347
METRIC RANK
5.5%
MALE UNEMPLOYMENT
6.3/ 100
METRIC RATING
213th/ 347
METRIC RANK
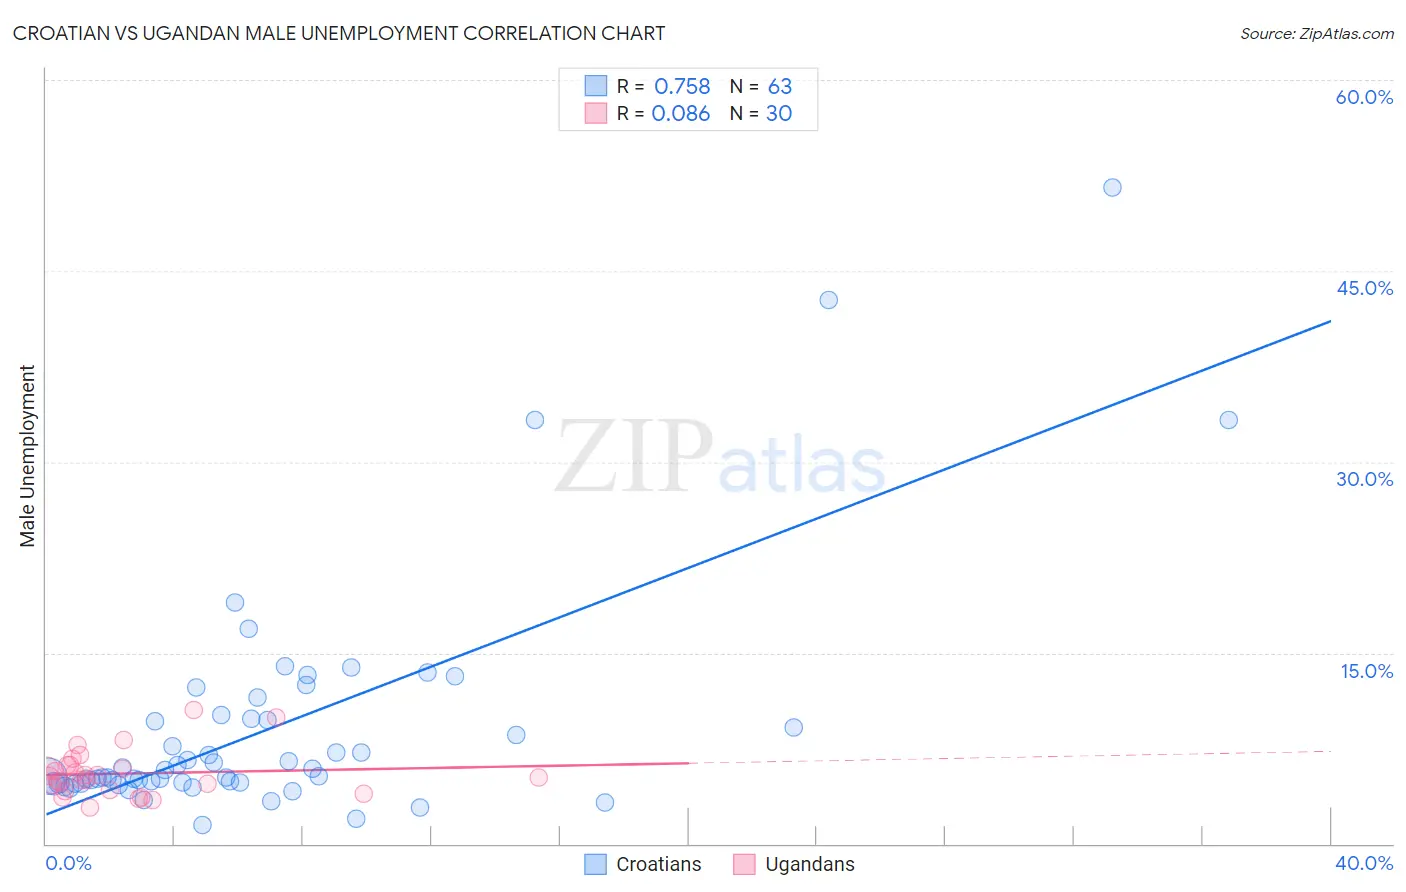
Croatian vs Ugandan Male Unemployment Correlation Chart
The statistical analysis conducted on geographies consisting of 374,058,909 people shows a strong positive correlation between the proportion of Croatians and unemployment rate among males in the United States with a correlation coefficient (R) of 0.758 and weighted average of 4.9%. Similarly, the statistical analysis conducted on geographies consisting of 93,962,786 people shows a slight positive correlation between the proportion of Ugandans and unemployment rate among males in the United States with a correlation coefficient (R) of 0.086 and weighted average of 5.5%, a difference of 11.2%.
Male Unemployment Correlation Summary
| Measurement | Croatian | Ugandan |
| Minimum | 1.5% | 2.8% |
| Maximum | 51.6% | 10.5% |
| Range | 50.1% | 7.7% |
| Mean | 9.1% | 5.5% |
| Median | 5.3% | 5.3% |
| Interquartile 25% (IQ1) | 4.8% | 4.2% |
| Interquartile 75% (IQ3) | 9.8% | 6.2% |
| Interquartile Range (IQR) | 5.0% | 2.0% |
| Standard Deviation (Sample) | 9.1% | 1.8% |
| Standard Deviation (Population) | 9.1% | 1.8% |
Similar Demographics by Male Unemployment
Demographics Similar to Croatians by Male Unemployment
In terms of male unemployment, the demographic groups most similar to Croatians are Polish (4.9%, a difference of 0.010%), Immigrants from Scotland (4.9%, a difference of 0.020%), Austrian (4.9%, a difference of 0.040%), Slovene (5.0%, a difference of 0.040%), and Irish (5.0%, a difference of 0.060%).
| Demographics | Rating | Rank | Male Unemployment |
| Immigrants | Japan | 99.2 /100 | #43 | Exceptional 4.9% |
| Immigrants | Korea | 99.1 /100 | #44 | Exceptional 4.9% |
| Immigrants | Zimbabwe | 99.0 /100 | #45 | Exceptional 4.9% |
| Bhutanese | 98.9 /100 | #46 | Exceptional 4.9% |
| Austrians | 98.9 /100 | #47 | Exceptional 4.9% |
| Immigrants | Scotland | 98.9 /100 | #48 | Exceptional 4.9% |
| Poles | 98.9 /100 | #49 | Exceptional 4.9% |
| Croatians | 98.9 /100 | #50 | Exceptional 4.9% |
| Slovenes | 98.8 /100 | #51 | Exceptional 5.0% |
| Irish | 98.8 /100 | #52 | Exceptional 5.0% |
| Jordanians | 98.8 /100 | #53 | Exceptional 5.0% |
| Yugoslavians | 98.7 /100 | #54 | Exceptional 5.0% |
| Czechoslovakians | 98.7 /100 | #55 | Exceptional 5.0% |
| Immigrants | Bulgaria | 98.7 /100 | #56 | Exceptional 5.0% |
| Turks | 98.5 /100 | #57 | Exceptional 5.0% |
Demographics Similar to Ugandans by Male Unemployment
In terms of male unemployment, the demographic groups most similar to Ugandans are Hmong (5.5%, a difference of 0.16%), Puget Sound Salish (5.5%, a difference of 0.17%), Israeli (5.5%, a difference of 0.25%), South American Indian (5.5%, a difference of 0.30%), and Samoan (5.5%, a difference of 0.37%).
| Demographics | Rating | Rank | Male Unemployment |
| Immigrants | Ukraine | 9.9 /100 | #206 | Tragic 5.5% |
| Immigrants | Syria | 9.3 /100 | #207 | Tragic 5.5% |
| Immigrants | Lebanon | 8.6 /100 | #208 | Tragic 5.5% |
| Immigrants | Middle Africa | 8.3 /100 | #209 | Tragic 5.5% |
| South American Indians | 7.6 /100 | #210 | Tragic 5.5% |
| Israelis | 7.4 /100 | #211 | Tragic 5.5% |
| Hmong | 7.0 /100 | #212 | Tragic 5.5% |
| Ugandans | 6.3 /100 | #213 | Tragic 5.5% |
| Puget Sound Salish | 5.6 /100 | #214 | Tragic 5.5% |
| Samoans | 4.9 /100 | #215 | Tragic 5.5% |
| Immigrants | Immigrants | 4.3 /100 | #216 | Tragic 5.5% |
| Delaware | 4.2 /100 | #217 | Tragic 5.5% |
| Immigrants | Albania | 3.6 /100 | #218 | Tragic 5.5% |
| Immigrants | Western Asia | 3.5 /100 | #219 | Tragic 5.6% |
| Portuguese | 3.5 /100 | #220 | Tragic 5.6% |