Croatian vs Celtic Male Unemployment
COMPARE
Croatian
Celtic
Male Unemployment
Male Unemployment Comparison
Croatians
Celtics
4.9%
MALE UNEMPLOYMENT
98.9/ 100
METRIC RATING
50th/ 347
METRIC RANK
5.0%
MALE UNEMPLOYMENT
97.8/ 100
METRIC RATING
64th/ 347
METRIC RANK
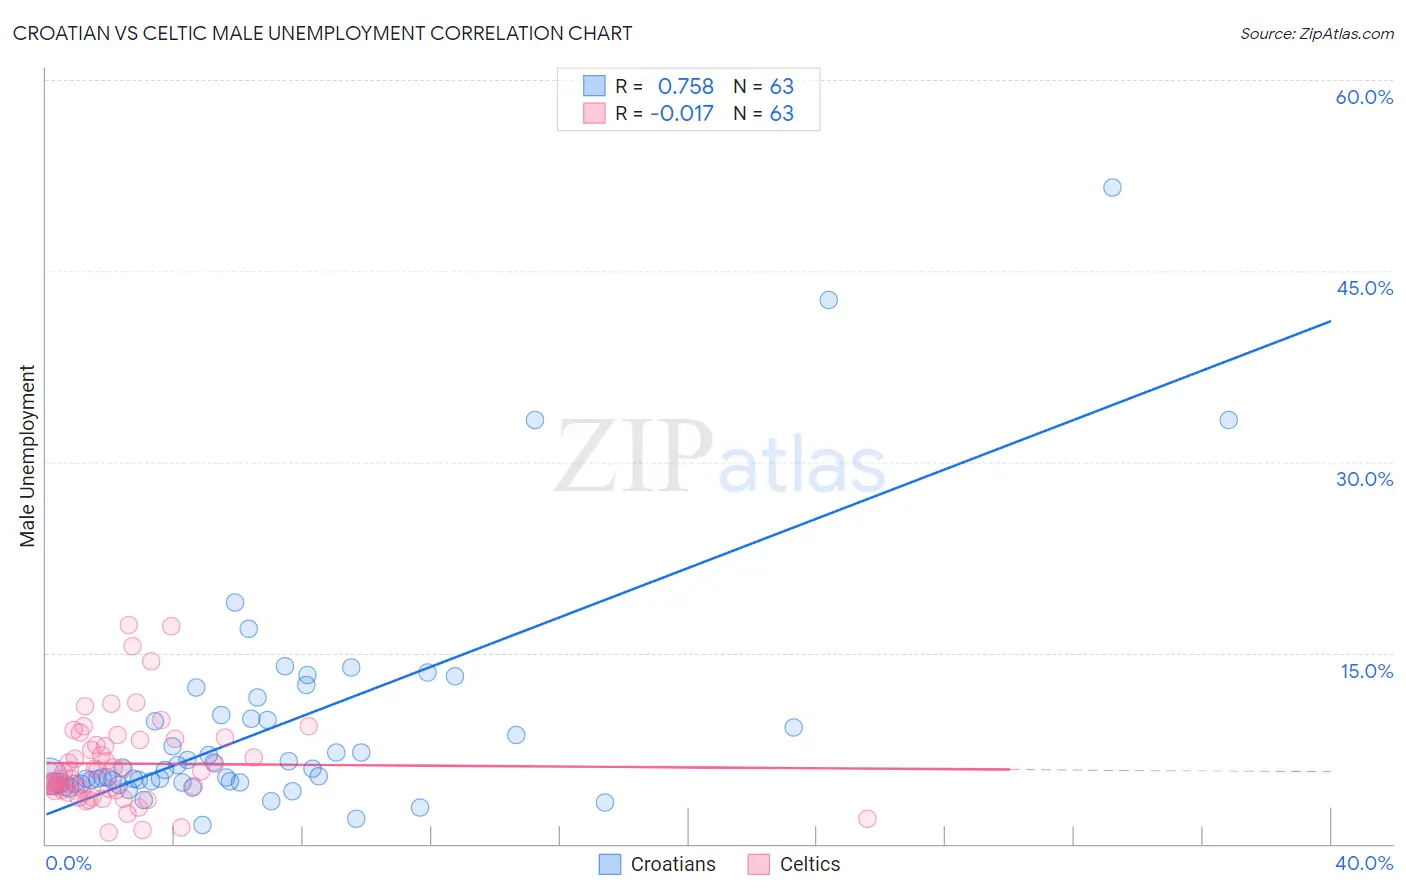
Croatian vs Celtic Male Unemployment Correlation Chart
The statistical analysis conducted on geographies consisting of 374,058,909 people shows a strong positive correlation between the proportion of Croatians and unemployment rate among males in the United States with a correlation coefficient (R) of 0.758 and weighted average of 4.9%. Similarly, the statistical analysis conducted on geographies consisting of 168,462,496 people shows no correlation between the proportion of Celtics and unemployment rate among males in the United States with a correlation coefficient (R) of -0.017 and weighted average of 5.0%, a difference of 1.0%.
Male Unemployment Correlation Summary
| Measurement | Croatian | Celtic |
| Minimum | 1.5% | 0.90% |
| Maximum | 51.6% | 17.2% |
| Range | 50.1% | 16.3% |
| Mean | 9.1% | 6.3% |
| Median | 5.3% | 5.6% |
| Interquartile 25% (IQ1) | 4.8% | 4.2% |
| Interquartile 75% (IQ3) | 9.8% | 8.2% |
| Interquartile Range (IQR) | 5.0% | 4.0% |
| Standard Deviation (Sample) | 9.1% | 3.5% |
| Standard Deviation (Population) | 9.1% | 3.5% |
Demographics Similar to Croatians and Celtics by Male Unemployment
In terms of male unemployment, the demographic groups most similar to Croatians are Polish (4.9%, a difference of 0.010%), Immigrants from Scotland (4.9%, a difference of 0.020%), Austrian (4.9%, a difference of 0.040%), Slovene (5.0%, a difference of 0.040%), and Irish (5.0%, a difference of 0.060%). Similarly, the demographic groups most similar to Celtics are Eastern European (5.0%, a difference of 0.020%), Basque (5.0%, a difference of 0.030%), Cambodian (5.0%, a difference of 0.16%), Icelander (5.0%, a difference of 0.16%), and Immigrants from Argentina (5.0%, a difference of 0.24%).
| Demographics | Rating | Rank | Male Unemployment |
| Austrians | 98.9 /100 | #47 | Exceptional 4.9% |
| Immigrants | Scotland | 98.9 /100 | #48 | Exceptional 4.9% |
| Poles | 98.9 /100 | #49 | Exceptional 4.9% |
| Croatians | 98.9 /100 | #50 | Exceptional 4.9% |
| Slovenes | 98.8 /100 | #51 | Exceptional 5.0% |
| Irish | 98.8 /100 | #52 | Exceptional 5.0% |
| Jordanians | 98.8 /100 | #53 | Exceptional 5.0% |
| Yugoslavians | 98.7 /100 | #54 | Exceptional 5.0% |
| Czechoslovakians | 98.7 /100 | #55 | Exceptional 5.0% |
| Immigrants | Bulgaria | 98.7 /100 | #56 | Exceptional 5.0% |
| Turks | 98.5 /100 | #57 | Exceptional 5.0% |
| Lithuanians | 98.5 /100 | #58 | Exceptional 5.0% |
| Immigrants | Netherlands | 98.3 /100 | #59 | Exceptional 5.0% |
| Immigrants | Argentina | 98.1 /100 | #60 | Exceptional 5.0% |
| Cambodians | 98.1 /100 | #61 | Exceptional 5.0% |
| Basques | 97.9 /100 | #62 | Exceptional 5.0% |
| Eastern Europeans | 97.9 /100 | #63 | Exceptional 5.0% |
| Celtics | 97.8 /100 | #64 | Exceptional 5.0% |
| Icelanders | 97.6 /100 | #65 | Exceptional 5.0% |
| Finns | 97.5 /100 | #66 | Exceptional 5.0% |
| Immigrants | Canada | 97.5 /100 | #67 | Exceptional 5.0% |