Brazilian vs Immigrants from Jamaica Unemployment Among Ages 20 to 24 years
COMPARE
Brazilian
Immigrants from Jamaica
Unemployment Among Ages 20 to 24 years
Unemployment Among Ages 20 to 24 years Comparison
Brazilians
Immigrants from Jamaica
10.2%
UNEMPLOYMENT AMONG AGES 20 TO 24 YEARS
78.4/ 100
METRIC RATING
144th/ 347
METRIC RANK
13.0%
UNEMPLOYMENT AMONG AGES 20 TO 24 YEARS
0.0/ 100
METRIC RATING
321st/ 347
METRIC RANK
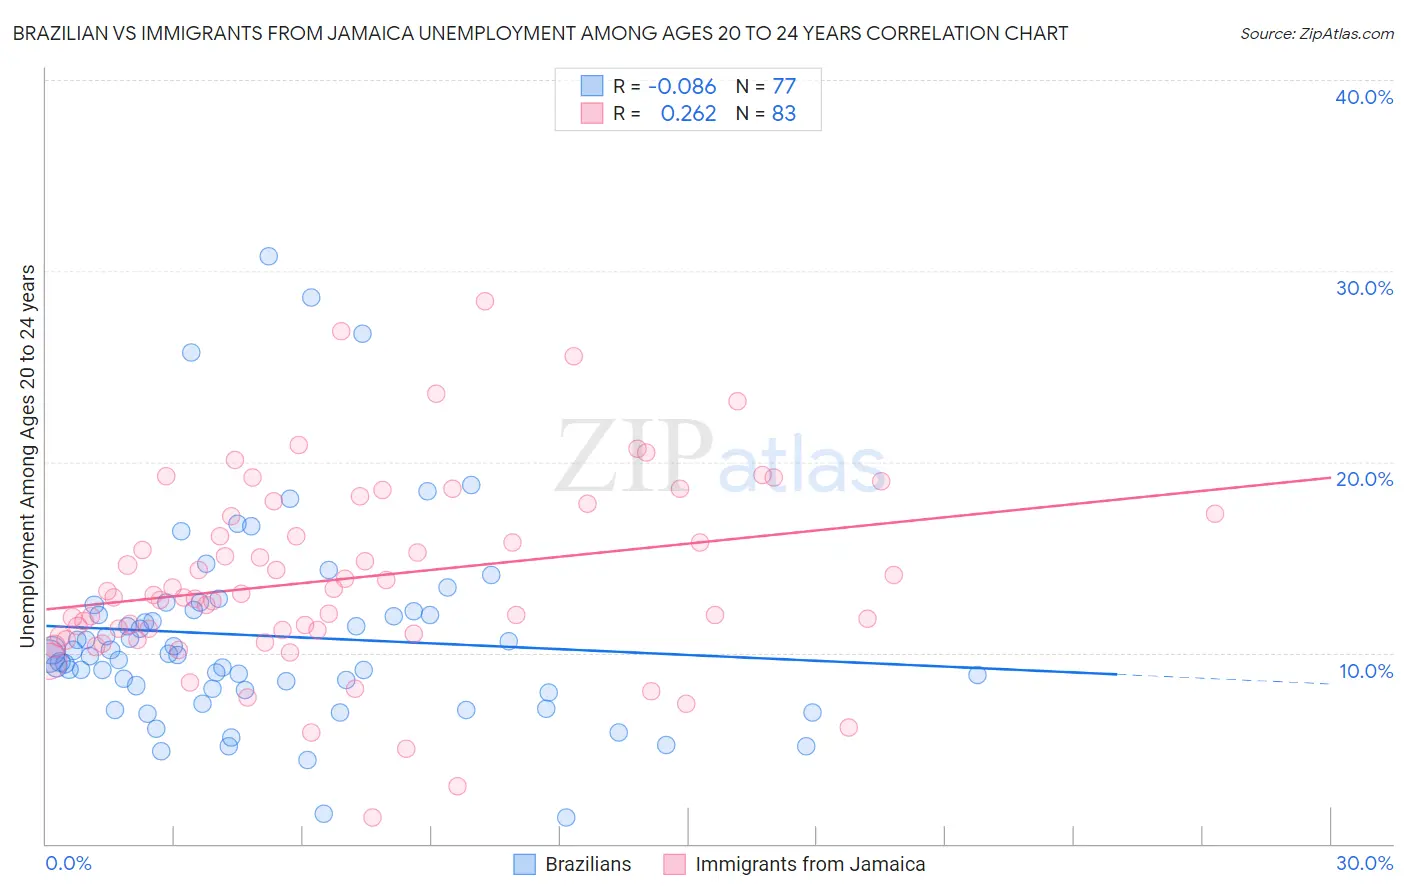
Brazilian vs Immigrants from Jamaica Unemployment Among Ages 20 to 24 years Correlation Chart
The statistical analysis conducted on geographies consisting of 317,079,134 people shows a slight negative correlation between the proportion of Brazilians and unemployment rate among population between the ages 20 and 24 in the United States with a correlation coefficient (R) of -0.086 and weighted average of 10.2%. Similarly, the statistical analysis conducted on geographies consisting of 295,465,430 people shows a weak positive correlation between the proportion of Immigrants from Jamaica and unemployment rate among population between the ages 20 and 24 in the United States with a correlation coefficient (R) of 0.262 and weighted average of 13.0%, a difference of 27.3%.
Unemployment Among Ages 20 to 24 years Correlation Summary
| Measurement | Brazilian | Immigrants from Jamaica |
| Minimum | 1.4% | 1.4% |
| Maximum | 30.8% | 28.4% |
| Range | 29.4% | 27.0% |
| Mean | 10.9% | 13.9% |
| Median | 9.9% | 13.0% |
| Interquartile 25% (IQ1) | 8.1% | 11.0% |
| Interquartile 75% (IQ3) | 12.2% | 17.3% |
| Interquartile Range (IQR) | 4.1% | 6.3% |
| Standard Deviation (Sample) | 5.3% | 5.0% |
| Standard Deviation (Population) | 5.3% | 5.0% |
Similar Demographics by Unemployment Among Ages 20 to 24 years
Demographics Similar to Brazilians by Unemployment Among Ages 20 to 24 years
In terms of unemployment among ages 20 to 24 years, the demographic groups most similar to Brazilians are Argentinean (10.2%, a difference of 0.020%), Immigrants from Jordan (10.2%, a difference of 0.040%), Asian (10.2%, a difference of 0.040%), French Canadian (10.2%, a difference of 0.040%), and Slovak (10.2%, a difference of 0.11%).
| Demographics | Rating | Rank | Unemployment Among Ages 20 to 24 years |
| Immigrants | North America | 82.5 /100 | #137 | Excellent 10.2% |
| Burmese | 82.3 /100 | #138 | Excellent 10.2% |
| Uruguayans | 81.9 /100 | #139 | Excellent 10.2% |
| Immigrants | Austria | 81.4 /100 | #140 | Excellent 10.2% |
| Immigrants | Azores | 81.4 /100 | #141 | Excellent 10.2% |
| Slovaks | 80.2 /100 | #142 | Excellent 10.2% |
| Immigrants | Jordan | 79.0 /100 | #143 | Good 10.2% |
| Brazilians | 78.4 /100 | #144 | Good 10.2% |
| Argentineans | 78.0 /100 | #145 | Good 10.2% |
| Asians | 77.7 /100 | #146 | Good 10.2% |
| French Canadians | 77.5 /100 | #147 | Good 10.2% |
| Immigrants | Romania | 75.7 /100 | #148 | Good 10.2% |
| Immigrants | Scotland | 74.6 /100 | #149 | Good 10.2% |
| Hungarians | 74.4 /100 | #150 | Good 10.2% |
| Immigrants | South Africa | 73.6 /100 | #151 | Good 10.2% |
Demographics Similar to Immigrants from Jamaica by Unemployment Among Ages 20 to 24 years
In terms of unemployment among ages 20 to 24 years, the demographic groups most similar to Immigrants from Jamaica are Cheyenne (13.0%, a difference of 0.080%), Native/Alaskan (13.0%, a difference of 0.38%), Trinidadian and Tobagonian (12.9%, a difference of 0.51%), Barbadian (12.9%, a difference of 0.76%), and Yakama (13.1%, a difference of 0.86%).
| Demographics | Rating | Rank | Unemployment Among Ages 20 to 24 years |
| Blacks/African Americans | 0.0 /100 | #314 | Tragic 12.7% |
| West Indians | 0.0 /100 | #315 | Tragic 12.8% |
| Immigrants | Dominica | 0.0 /100 | #316 | Tragic 12.8% |
| Immigrants | Trinidad and Tobago | 0.0 /100 | #317 | Tragic 12.8% |
| Barbadians | 0.0 /100 | #318 | Tragic 12.9% |
| Trinidadians and Tobagonians | 0.0 /100 | #319 | Tragic 12.9% |
| Cheyenne | 0.0 /100 | #320 | Tragic 13.0% |
| Immigrants | Jamaica | 0.0 /100 | #321 | Tragic 13.0% |
| Natives/Alaskans | 0.0 /100 | #322 | Tragic 13.0% |
| Yakama | 0.0 /100 | #323 | Tragic 13.1% |
| Alaska Natives | 0.0 /100 | #324 | Tragic 13.2% |
| Pueblo | 0.0 /100 | #325 | Tragic 13.2% |
| Immigrants | Barbados | 0.0 /100 | #326 | Tragic 13.5% |
| Immigrants | Dominican Republic | 0.0 /100 | #327 | Tragic 13.6% |
| British West Indians | 0.0 /100 | #328 | Tragic 13.7% |