Marshallese vs Immigrants from Jamaica Unemployment Among Ages 20 to 24 years

COMPARE

Marshallese
Race
Ancestry
AfghanAfricanAlaska NativeAlaskan AthabascanAlbanianAleutAlsatianAmericanApacheArabArapahoArgentineanArmenianAssyrian/Chaldean/SyriacAustralianAustrianBahamianBangladeshiBarbadianBasqueBelgianBelizeanBermudanBhutaneseBlackfeetBolivianBrazilianBritishBritish West IndianBulgarianBurmeseCajunCambodianCanadianCape VerdeanCarpatho RusynCelticCentral AmericanCentral American IndianCherokeeCheyenneChickasawChileanChineseChippewaChoctawColombianColvilleComancheCosta RicanCreeCreekCroatianCrowCubanCypriotCzechCzechoslovakianDanishDelawareDominicanDutchDutch West IndianEastern EuropeanEcuadorianEgyptianEnglishEstonianEthiopianEuropeanFijianFilipinoFinnishFrenchFrench American IndianFrench CanadianGermanGerman RussianGhanaianGreekGuamanian/ChamorroGuatemalanGuyaneseHaitianHmongHonduranHopiHoumaHungarianIcelanderIndian (Asian)IndonesianInupiatIranianIraqiIrishIroquoisIsraeliItalianJamaicanJapaneseJordanianKenyanKiowaKoreanLaotianLatvianLebaneseLiberianLithuanianLumbeeLuxembourgerMacedonianMalaysianMalteseMarshalleseMenomineeMexicanMexican American IndianMongolianMoroccanNative HawaiianNavajoNepaleseNew ZealanderNicaraguanNigerianNorthern EuropeanNorwegianOkinawanOsageOttawaPaiutePakistaniPalestinianPanamanianParaguayanPennsylvania GermanPeruvianPimaPolishPortuguesePotawatomiPuebloPuerto RicanPuget Sound SalishRomanianRussianSalvadoranSamoanScandinavianScotch-IrishScottishSeminoleSenegaleseSerbianShoshoneSierra LeoneanSiouxSlavicSlovakSloveneSomaliSouth AfricanSouth AmericanSouth American IndianSoviet UnionSpaniardSpanishSpanish AmericanSpanish American IndianSri LankanSubsaharan AfricanSudaneseSwedishSwissSyrianTaiwaneseThaiTlingit-HaidaTohono O'OdhamTonganTrinidadian and TobagonianTsimshianTurkishU.S. Virgin IslanderUgandanUkrainianUruguayanUteVenezuelanVietnameseWelshWest IndianYakamaYaquiYugoslavianYumanYup'ikZimbabwean
Immigration
NonimmigrantsImmigrantsAfghanistanAfricaAlbaniaArgentinaArmeniaAsiaAustraliaAustriaBahamasBangladeshBarbadosBelarusBelgiumBelizeBoliviaBosnia and HerzegovinaBrazilBulgariaBurma/MyanmarCabo VerdeCambodiaCameroonCanadaCaribbeanCentral AmericaChileChinaColombiaCongoCosta RicaCroatiaCubaCzechoslovakiaDenmarkDominicaDominican RepublicEastern AfricaEastern AsiaEastern EuropeEcuadorEgyptEl SalvadorEnglandEritreaEthiopiaEuropeFijiFranceGermanyGhanaGreeceGrenadaGuatemalaGuyanaHaitiHondurasHong KongHungaryIndiaIndonesiaIranIraqIrelandIsraelItalyJapanJordanKazakhstanKenyaKoreaKuwaitLaosLatin AmericaLatviaLebanonLiberiaLithuaniaMalaysiaMexicoMicronesiaMiddle AfricaMoldovaMoroccoNepalNetherlandsNicaraguaNigeriaNorth AmericaNorth MacedoniaNorthern AfricaNorthern EuropeNorwayOceaniaPakistanPanamaPeruPhilippinesPolandPortugalRomaniaRussiaSaudi ArabiaScotlandSenegalSerbiaSierra LeoneSingaporeSomaliaSouth AfricaSouth AmericaSouth Central AsiaSouth Eastern AsiaSouthern EuropeSpainSri LankaSt. Vincent and the GrenadinesSudanSwedenSwitzerlandSyriaTaiwanThailandTrinidad and TobagoTurkeyUgandaUkraineUruguayUzbekistanVenezuelaVietnamWest IndiesWestern AfricaWestern AsiaWestern EuropeYemenZaireZimbabweAzores
Immigrants from Jamaica
Race
Ancestry
AfghanAfricanAlaska NativeAlaskan AthabascanAlbanianAleutAlsatianAmericanApacheArabArapahoArgentineanArmenianAssyrian/Chaldean/SyriacAustralianAustrianBahamianBangladeshiBarbadianBasqueBelgianBelizeanBermudanBhutaneseBlackfeetBolivianBrazilianBritishBritish West IndianBulgarianBurmeseCajunCambodianCanadianCape VerdeanCarpatho RusynCelticCentral AmericanCentral American IndianCherokeeCheyenneChickasawChileanChineseChippewaChoctawColombianColvilleComancheCosta RicanCreeCreekCroatianCrowCubanCypriotCzechCzechoslovakianDanishDelawareDominicanDutchDutch West IndianEastern EuropeanEcuadorianEgyptianEnglishEstonianEthiopianEuropeanFijianFilipinoFinnishFrenchFrench American IndianFrench CanadianGermanGerman RussianGhanaianGreekGuamanian/ChamorroGuatemalanGuyaneseHaitianHmongHonduranHopiHoumaHungarianIcelanderIndian (Asian)IndonesianInupiatIranianIraqiIrishIroquoisIsraeliItalianJamaicanJapaneseJordanianKenyanKiowaKoreanLaotianLatvianLebaneseLiberianLithuanianLumbeeLuxembourgerMacedonianMalaysianMalteseMenomineeMexicanMexican American IndianMongolianMoroccanNative HawaiianNavajoNepaleseNew ZealanderNicaraguanNigerianNorthern EuropeanNorwegianOkinawanOsageOttawaPaiutePakistaniPalestinianPanamanianParaguayanPennsylvania GermanPeruvianPimaPolishPortuguesePotawatomiPuebloPuerto RicanPuget Sound SalishRomanianRussianSalvadoranSamoanScandinavianScotch-IrishScottishSeminoleSenegaleseSerbianShoshoneSierra LeoneanSiouxSlavicSlovakSloveneSomaliSouth AfricanSouth AmericanSouth American IndianSoviet UnionSpaniardSpanishSpanish AmericanSpanish American IndianSri LankanSubsaharan AfricanSudaneseSwedishSwissSyrianTaiwaneseThaiTlingit-HaidaTohono O'OdhamTonganTrinidadian and TobagonianTsimshianTurkishU.S. Virgin IslanderUgandanUkrainianUruguayanUteVenezuelanVietnameseWelshWest IndianYakamaYaquiYugoslavianYumanYup'ikZimbabwean
Immigration
NonimmigrantsImmigrantsAfghanistanAfricaAlbaniaArgentinaArmeniaAsiaAustraliaAustriaBahamasBangladeshBarbadosBelarusBelgiumBelizeBoliviaBosnia and HerzegovinaBrazilBulgariaBurma/MyanmarCabo VerdeCambodiaCameroonCanadaCaribbeanCentral AmericaChileChinaColombiaCongoCosta RicaCroatiaCubaCzechoslovakiaDenmarkDominicaDominican RepublicEastern AfricaEastern AsiaEastern EuropeEcuadorEgyptEl SalvadorEnglandEritreaEthiopiaEuropeFijiFranceGermanyGhanaGreeceGrenadaGuatemalaGuyanaHaitiHondurasHong KongHungaryIndiaIndonesiaIranIraqIrelandIsraelItalyJamaicaJapanJordanKazakhstanKenyaKoreaKuwaitLaosLatin AmericaLatviaLebanonLiberiaLithuaniaMalaysiaMexicoMicronesiaMiddle AfricaMoldovaMoroccoNepalNetherlandsNicaraguaNigeriaNorth AmericaNorth MacedoniaNorthern AfricaNorthern EuropeNorwayOceaniaPakistanPanamaPeruPhilippinesPolandPortugalRomaniaRussiaSaudi ArabiaScotlandSenegalSerbiaSierra LeoneSingaporeSomaliaSouth AfricaSouth AmericaSouth Central AsiaSouth Eastern AsiaSouthern EuropeSpainSri LankaSt. Vincent and the GrenadinesSudanSwedenSwitzerlandSyriaTaiwanThailandTrinidad and TobagoTurkeyUgandaUkraineUruguayUzbekistanVenezuelaVietnamWest IndiesWestern AfricaWestern AsiaWestern EuropeYemenZaireZimbabweAzores
Unemployment Among Ages 20 to 24 years
Income
Poverty
Unemployment
Labor Participation
Family Structure
Vehicle Availability
Education Level
Disability

Unemployment Among Ages 20 to 24 years Comparison

Marshallese

Immigrants from Jamaica

Tragic
Tragic
11.0%
UNEMPLOYMENT AMONG AGES 20 TO 24 YEARS
0.1/ 100
METRIC RATING
263rd/ 347
METRIC RANK
13.0%
UNEMPLOYMENT AMONG AGES 20 TO 24 YEARS
0.0/ 100
METRIC RATING
321st/ 347
METRIC RANK

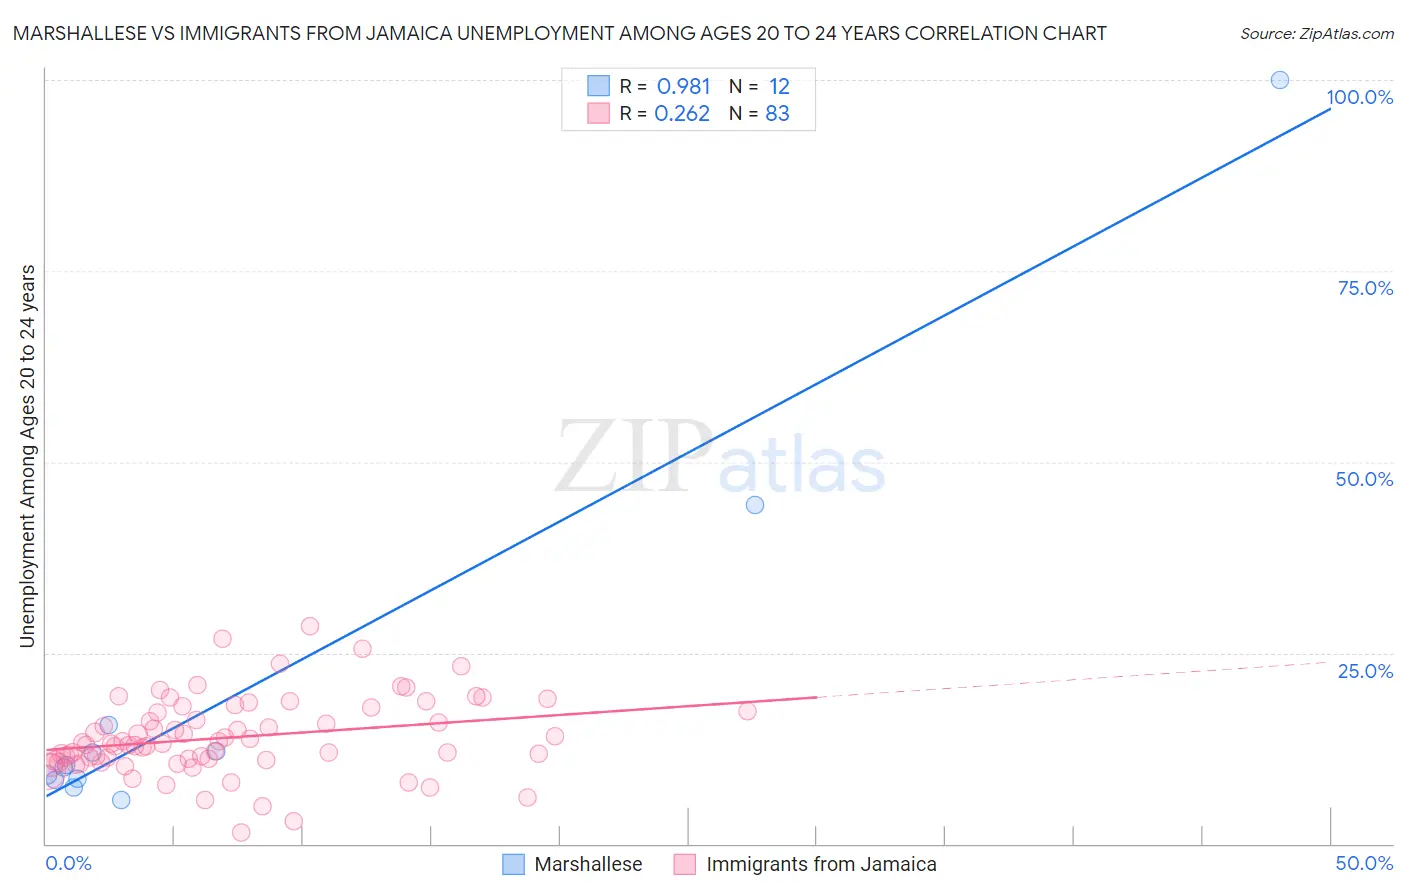
Marshallese vs Immigrants from Jamaica Unemployment Among Ages 20 to 24 years Correlation Chart

The statistical analysis conducted on geographies consisting of 14,697,252 people shows a perfect positive correlation between the proportion of Marshallese and unemployment rate among population between the ages 20 and 24 in the United States with a correlation coefficient (R) of 0.981 and weighted average of 11.0%. Similarly, the statistical analysis conducted on geographies consisting of 295,465,430 people shows a weak positive correlation between the proportion of Immigrants from Jamaica and unemployment rate among population between the ages 20 and 24 in the United States with a correlation coefficient (R) of 0.262 and weighted average of 13.0%, a difference of 18.0%.
Marshallese vs Immigrants from Jamaica Unemployment Among Ages 20 to 24 years

Unemployment Among Ages 20 to 24 years Correlation Summary

MeasurementMarshalleseImmigrants from Jamaica
Minimum5.7%1.4%
Maximum100.0%28.4%
Range94.3%27.0%
Mean20.2%13.9%
Median10.1%13.0%
Interquartile 25% (IQ1)8.4%11.0%
Interquartile 75% (IQ3)13.8%17.3%
Interquartile Range (IQR)5.4%6.3%
Standard Deviation (Sample)27.1%5.0%
Standard Deviation (Population)26.0%5.0%

Similar Demographics by Unemployment Among Ages 20 to 24 years

Demographics Similar to Marshallese by Unemployment Among Ages 20 to 24 years

In terms of unemployment among ages 20 to 24 years, the demographic groups most similar to Marshallese are Immigrants from Latin America (11.0%, a difference of 0.29%), Puget Sound Salish (10.9%, a difference of 0.75%), Subsaharan African (11.1%, a difference of 0.75%), Immigrants from Ireland (11.1%, a difference of 0.82%), and Immigrants from Liberia (11.1%, a difference of 0.91%).
DemographicsRating | RankUnemployment Among Ages 20 to 24 years
Immigrants | Bahamas
0.3
/100
|
#256
Tragic
10.9%
Immigrants | Western Asia
0.3
/100
|
#257
Tragic
10.9%
Dutch West Indians
0.3
/100
|
#258
Tragic
10.9%
Panamanians
0.2
/100
|
#259
Tragic
10.9%
Immigrants | Lebanon
0.2
/100
|
#260
Tragic
10.9%
Puget Sound Salish
0.2
/100
|
#261
Tragic
10.9%
Immigrants | Latin America
0.1
/100
|
#262
Tragic
11.0%
Marshallese
0.1
/100
|
#263
Tragic
11.0%
Sub-Saharan Africans
0.0
/100
|
#264
Tragic
11.1%
Immigrants | Ireland
0.0
/100
|
#265
Tragic
11.1%
Immigrants | Liberia
0.0
/100
|
#266
Tragic
11.1%
Immigrants | Greece
0.0
/100
|
#267
Tragic
11.1%
Maltese
0.0
/100
|
#268
Tragic
11.2%
Ute
0.0
/100
|
#269
Tragic
11.2%
Delaware
0.0
/100
|
#270
Tragic
11.3%

Demographics Similar to Immigrants from Jamaica by Unemployment Among Ages 20 to 24 years

In terms of unemployment among ages 20 to 24 years, the demographic groups most similar to Immigrants from Jamaica are Cheyenne (13.0%, a difference of 0.080%), Native/Alaskan (13.0%, a difference of 0.38%), Trinidadian and Tobagonian (12.9%, a difference of 0.51%), Barbadian (12.9%, a difference of 0.76%), and Yakama (13.1%, a difference of 0.86%).
DemographicsRating | RankUnemployment Among Ages 20 to 24 years
Blacks/African Americans
0.0
/100
|
#314
Tragic
12.7%
West Indians
0.0
/100
|
#315
Tragic
12.8%
Immigrants | Dominica
0.0
/100
|
#316
Tragic
12.8%
Immigrants | Trinidad and Tobago
0.0
/100
|
#317
Tragic
12.8%
Barbadians
0.0
/100
|
#318
Tragic
12.9%
Trinidadians and Tobagonians
0.0
/100
|
#319
Tragic
12.9%
Cheyenne
0.0
/100
|
#320
Tragic
13.0%
Immigrants | Jamaica
0.0
/100
|
#321
Tragic
13.0%
Natives/Alaskans
0.0
/100
|
#322
Tragic
13.0%
Yakama
0.0
/100
|
#323
Tragic
13.1%
Alaska Natives
0.0
/100
|
#324
Tragic
13.2%
Pueblo
0.0
/100
|
#325
Tragic
13.2%
Immigrants | Barbados
0.0
/100
|
#326
Tragic
13.5%
Immigrants | Dominican Republic
0.0
/100
|
#327
Tragic
13.6%
British West Indians
0.0
/100
|
#328
Tragic
13.7%