Creek vs Black/African American Unemployment Among Women with Children Ages 6 to 17 years
COMPARE
Creek
Black/African American
Unemployment Among Women with Children Ages 6 to 17 years
Unemployment Among Women with Children Ages 6 to 17 years Comparison
Creek
Blacks/African Americans
9.4%
UNEMPLOYMENT AMONG WOMEN WITH CHILDREN AGES 6 TO 17 YEARS
1.2/ 100
METRIC RATING
252nd/ 347
METRIC RANK
11.4%
UNEMPLOYMENT AMONG WOMEN WITH CHILDREN AGES 6 TO 17 YEARS
0.0/ 100
METRIC RATING
331st/ 347
METRIC RANK
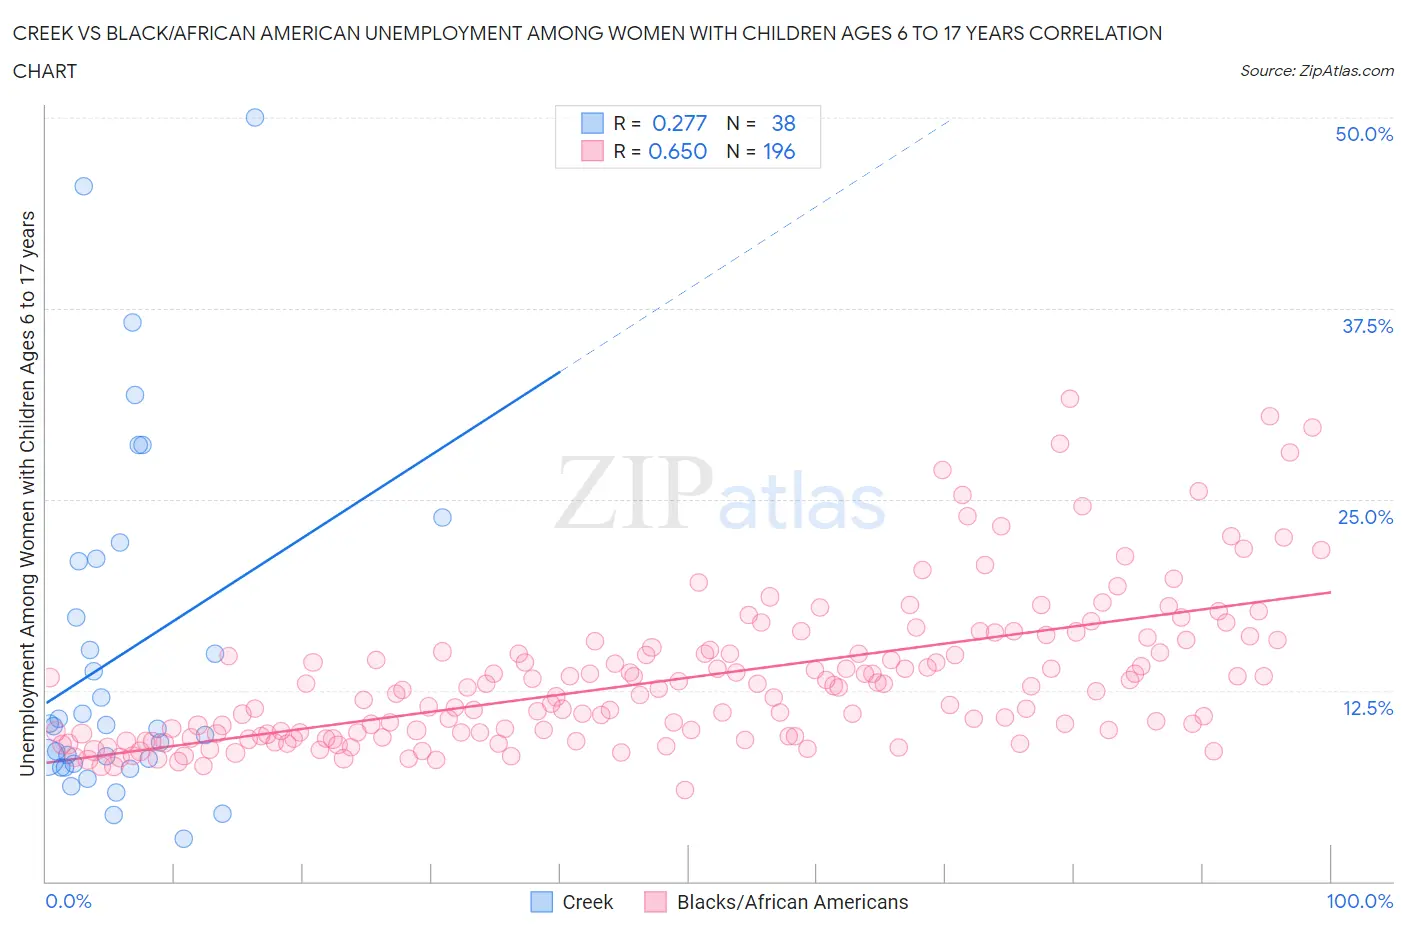
Creek vs Black/African American Unemployment Among Women with Children Ages 6 to 17 years Correlation Chart
The statistical analysis conducted on geographies consisting of 148,406,734 people shows a weak positive correlation between the proportion of Creek and unemployment rate among women with children between the ages 6 and 17 in the United States with a correlation coefficient (R) of 0.277 and weighted average of 9.4%. Similarly, the statistical analysis conducted on geographies consisting of 359,529,237 people shows a significant positive correlation between the proportion of Blacks/African Americans and unemployment rate among women with children between the ages 6 and 17 in the United States with a correlation coefficient (R) of 0.650 and weighted average of 11.4%, a difference of 21.0%.
Unemployment Among Women with Children Ages 6 to 17 years Correlation Summary
| Measurement | Creek | Black/African American |
| Minimum | 2.8% | 5.9% |
| Maximum | 50.0% | 31.6% |
| Range | 47.2% | 25.6% |
| Mean | 14.9% | 13.2% |
| Median | 10.2% | 12.3% |
| Interquartile 25% (IQ1) | 7.7% | 9.5% |
| Interquartile 75% (IQ3) | 21.0% | 15.0% |
| Interquartile Range (IQR) | 13.3% | 5.5% |
| Standard Deviation (Sample) | 11.3% | 4.9% |
| Standard Deviation (Population) | 11.2% | 4.9% |
Similar Demographics by Unemployment Among Women with Children Ages 6 to 17 years
Demographics Similar to Creek by Unemployment Among Women with Children Ages 6 to 17 years
In terms of unemployment among women with children ages 6 to 17 years, the demographic groups most similar to Creek are Central American (9.4%, a difference of 0.090%), Portuguese (9.4%, a difference of 0.090%), Immigrants from Guatemala (9.4%, a difference of 0.11%), Immigrants from South America (9.4%, a difference of 0.19%), and Dutch (9.4%, a difference of 0.20%).
| Demographics | Rating | Rank | Unemployment Among Women with Children Ages 6 to 17 years |
| Immigrants | Cameroon | 1.8 /100 | #245 | Tragic 9.4% |
| Immigrants | Africa | 1.6 /100 | #246 | Tragic 9.4% |
| Poles | 1.5 /100 | #247 | Tragic 9.4% |
| Dutch | 1.5 /100 | #248 | Tragic 9.4% |
| Immigrants | South America | 1.5 /100 | #249 | Tragic 9.4% |
| Immigrants | Guatemala | 1.3 /100 | #250 | Tragic 9.4% |
| Central Americans | 1.3 /100 | #251 | Tragic 9.4% |
| Creek | 1.2 /100 | #252 | Tragic 9.4% |
| Portuguese | 1.1 /100 | #253 | Tragic 9.4% |
| Nicaraguans | 1.0 /100 | #254 | Tragic 9.4% |
| Lithuanians | 0.9 /100 | #255 | Tragic 9.4% |
| Canadians | 0.8 /100 | #256 | Tragic 9.4% |
| Celtics | 0.7 /100 | #257 | Tragic 9.5% |
| Immigrants | Mexico | 0.7 /100 | #258 | Tragic 9.5% |
| Immigrants | Central America | 0.6 /100 | #259 | Tragic 9.5% |
Demographics Similar to Blacks/African Americans by Unemployment Among Women with Children Ages 6 to 17 years
In terms of unemployment among women with children ages 6 to 17 years, the demographic groups most similar to Blacks/African Americans are Tsimshian (11.4%, a difference of 0.11%), Native/Alaskan (11.5%, a difference of 0.74%), Chippewa (11.1%, a difference of 2.6%), Pennsylvania German (11.0%, a difference of 3.1%), and Ottawa (10.9%, a difference of 4.6%).
| Demographics | Rating | Rank | Unemployment Among Women with Children Ages 6 to 17 years |
| Immigrants | Dominican Republic | 0.0 /100 | #324 | Tragic 10.8% |
| Cajuns | 0.0 /100 | #325 | Tragic 10.8% |
| Liberians | 0.0 /100 | #326 | Tragic 10.8% |
| Cape Verdeans | 0.0 /100 | #327 | Tragic 10.9% |
| Ottawa | 0.0 /100 | #328 | Tragic 10.9% |
| Pennsylvania Germans | 0.0 /100 | #329 | Tragic 11.0% |
| Chippewa | 0.0 /100 | #330 | Tragic 11.1% |
| Blacks/African Americans | 0.0 /100 | #331 | Tragic 11.4% |
| Tsimshian | 0.0 /100 | #332 | Tragic 11.4% |
| Natives/Alaskans | 0.0 /100 | #333 | Tragic 11.5% |
| Ugandans | 0.0 /100 | #334 | Tragic 12.0% |
| Colville | 0.0 /100 | #335 | Tragic 12.3% |
| Houma | 0.0 /100 | #336 | Tragic 12.5% |
| Immigrants | Yemen | 0.0 /100 | #337 | Tragic 12.7% |
| Hopi | 0.0 /100 | #338 | Tragic 12.9% |