Creek vs Swedish Unemployment Among Women with Children Ages 6 to 17 years
COMPARE
Creek
Swedish
Unemployment Among Women with Children Ages 6 to 17 years
Unemployment Among Women with Children Ages 6 to 17 years Comparison
Creek
Swedes
9.4%
UNEMPLOYMENT AMONG WOMEN WITH CHILDREN AGES 6 TO 17 YEARS
1.2/ 100
METRIC RATING
252nd/ 347
METRIC RANK
8.6%
UNEMPLOYMENT AMONG WOMEN WITH CHILDREN AGES 6 TO 17 YEARS
97.6/ 100
METRIC RATING
108th/ 347
METRIC RANK
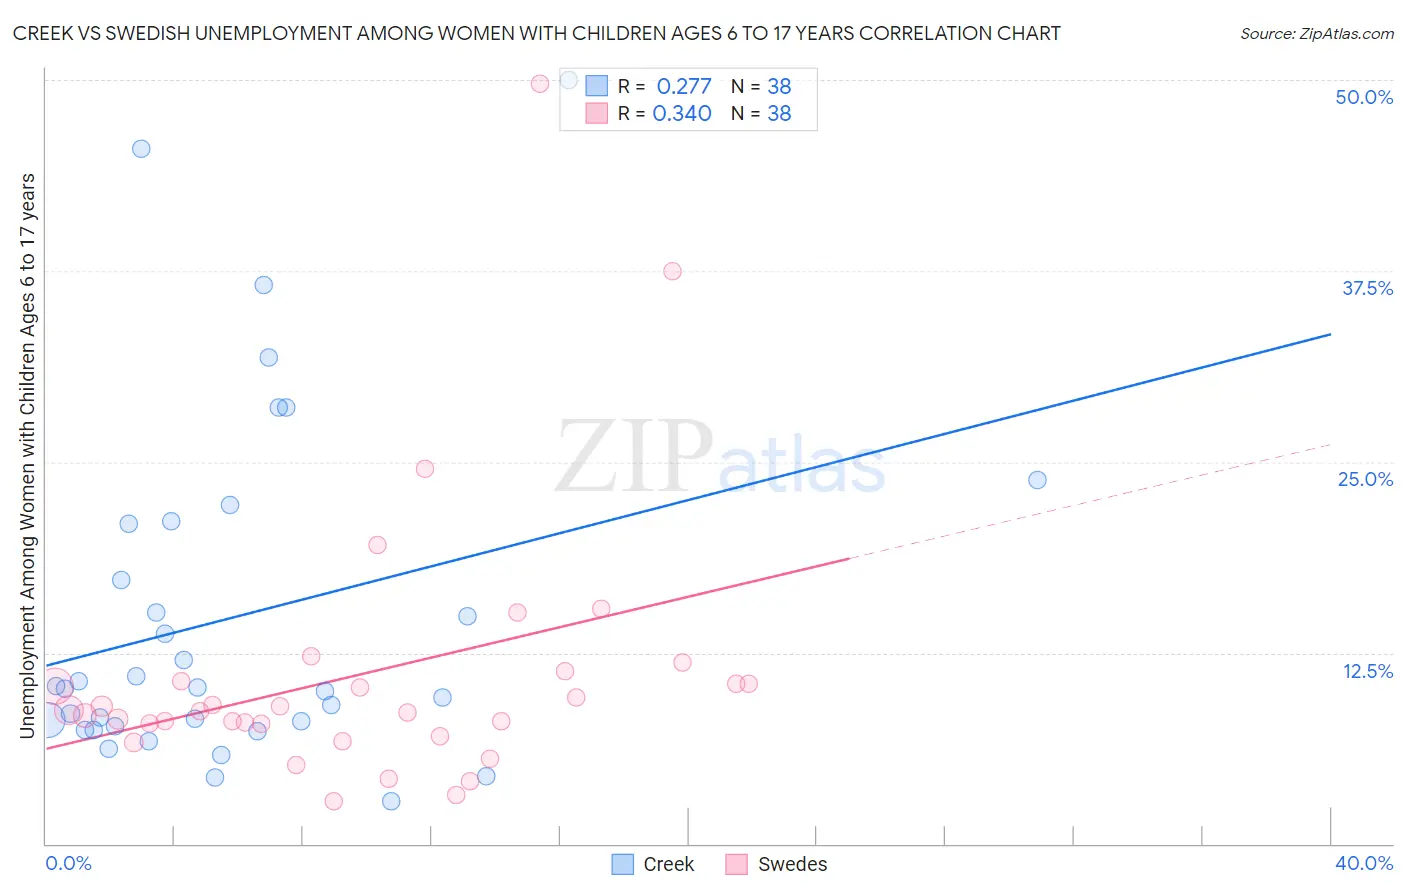
Creek vs Swedish Unemployment Among Women with Children Ages 6 to 17 years Correlation Chart
The statistical analysis conducted on geographies consisting of 148,406,734 people shows a weak positive correlation between the proportion of Creek and unemployment rate among women with children between the ages 6 and 17 in the United States with a correlation coefficient (R) of 0.277 and weighted average of 9.4%. Similarly, the statistical analysis conducted on geographies consisting of 343,411,572 people shows a mild positive correlation between the proportion of Swedes and unemployment rate among women with children between the ages 6 and 17 in the United States with a correlation coefficient (R) of 0.340 and weighted average of 8.6%, a difference of 9.4%.
Unemployment Among Women with Children Ages 6 to 17 years Correlation Summary
| Measurement | Creek | Swedish |
| Minimum | 2.8% | 2.8% |
| Maximum | 50.0% | 49.8% |
| Range | 47.2% | 47.0% |
| Mean | 14.9% | 11.1% |
| Median | 10.2% | 8.7% |
| Interquartile 25% (IQ1) | 7.7% | 7.9% |
| Interquartile 75% (IQ3) | 21.0% | 10.6% |
| Interquartile Range (IQR) | 13.3% | 2.7% |
| Standard Deviation (Sample) | 11.3% | 8.9% |
| Standard Deviation (Population) | 11.2% | 8.8% |
Similar Demographics by Unemployment Among Women with Children Ages 6 to 17 years
Demographics Similar to Creek by Unemployment Among Women with Children Ages 6 to 17 years
In terms of unemployment among women with children ages 6 to 17 years, the demographic groups most similar to Creek are Central American (9.4%, a difference of 0.090%), Portuguese (9.4%, a difference of 0.090%), Immigrants from Guatemala (9.4%, a difference of 0.11%), Immigrants from South America (9.4%, a difference of 0.19%), and Dutch (9.4%, a difference of 0.20%).
| Demographics | Rating | Rank | Unemployment Among Women with Children Ages 6 to 17 years |
| Immigrants | Cameroon | 1.8 /100 | #245 | Tragic 9.4% |
| Immigrants | Africa | 1.6 /100 | #246 | Tragic 9.4% |
| Poles | 1.5 /100 | #247 | Tragic 9.4% |
| Dutch | 1.5 /100 | #248 | Tragic 9.4% |
| Immigrants | South America | 1.5 /100 | #249 | Tragic 9.4% |
| Immigrants | Guatemala | 1.3 /100 | #250 | Tragic 9.4% |
| Central Americans | 1.3 /100 | #251 | Tragic 9.4% |
| Creek | 1.2 /100 | #252 | Tragic 9.4% |
| Portuguese | 1.1 /100 | #253 | Tragic 9.4% |
| Nicaraguans | 1.0 /100 | #254 | Tragic 9.4% |
| Lithuanians | 0.9 /100 | #255 | Tragic 9.4% |
| Canadians | 0.8 /100 | #256 | Tragic 9.4% |
| Celtics | 0.7 /100 | #257 | Tragic 9.5% |
| Immigrants | Mexico | 0.7 /100 | #258 | Tragic 9.5% |
| Immigrants | Central America | 0.6 /100 | #259 | Tragic 9.5% |
Demographics Similar to Swedes by Unemployment Among Women with Children Ages 6 to 17 years
In terms of unemployment among women with children ages 6 to 17 years, the demographic groups most similar to Swedes are Chickasaw (8.6%, a difference of 0.010%), Immigrants from Serbia (8.6%, a difference of 0.040%), Immigrants from Romania (8.6%, a difference of 0.070%), Immigrants from Norway (8.6%, a difference of 0.080%), and Latvian (8.6%, a difference of 0.080%).
| Demographics | Rating | Rank | Unemployment Among Women with Children Ages 6 to 17 years |
| Immigrants | Pakistan | 98.4 /100 | #101 | Exceptional 8.6% |
| Immigrants | South Africa | 98.3 /100 | #102 | Exceptional 8.6% |
| Scandinavians | 98.3 /100 | #103 | Exceptional 8.6% |
| Immigrants | France | 98.0 /100 | #104 | Exceptional 8.6% |
| Immigrants | Norway | 97.8 /100 | #105 | Exceptional 8.6% |
| Immigrants | Serbia | 97.7 /100 | #106 | Exceptional 8.6% |
| Chickasaw | 97.6 /100 | #107 | Exceptional 8.6% |
| Swedes | 97.6 /100 | #108 | Exceptional 8.6% |
| Immigrants | Romania | 97.5 /100 | #109 | Exceptional 8.6% |
| Latvians | 97.4 /100 | #110 | Exceptional 8.6% |
| Immigrants | Ukraine | 97.4 /100 | #111 | Exceptional 8.6% |
| Romanians | 97.1 /100 | #112 | Exceptional 8.6% |
| Eastern Europeans | 96.8 /100 | #113 | Exceptional 8.6% |
| Immigrants | Russia | 96.7 /100 | #114 | Exceptional 8.6% |
| Argentineans | 96.5 /100 | #115 | Exceptional 8.6% |