Cree vs Immigrants from Austria Unemployment Among Women with Children Ages 6 to 17 years
COMPARE
Cree
Immigrants from Austria
Unemployment Among Women with Children Ages 6 to 17 years
Unemployment Among Women with Children Ages 6 to 17 years Comparison
Cree
Immigrants from Austria
10.8%
UNEMPLOYMENT AMONG WOMEN WITH CHILDREN AGES 6 TO 17 YEARS
0.0/ 100
METRIC RATING
322nd/ 347
METRIC RANK
8.8%
UNEMPLOYMENT AMONG WOMEN WITH CHILDREN AGES 6 TO 17 YEARS
87.5/ 100
METRIC RATING
142nd/ 347
METRIC RANK
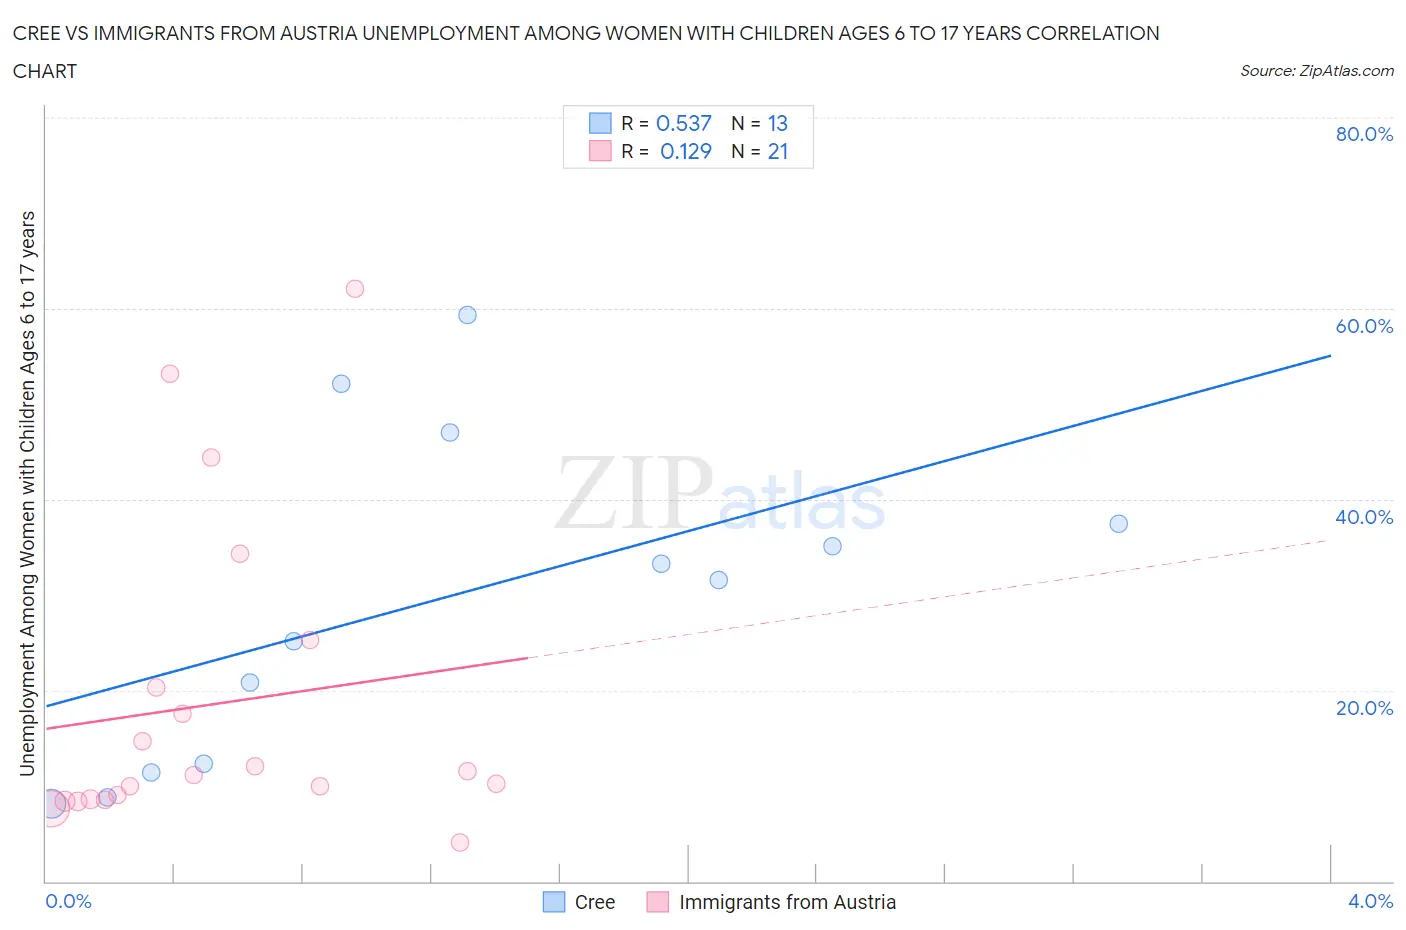
Cree vs Immigrants from Austria Unemployment Among Women with Children Ages 6 to 17 years Correlation Chart
The statistical analysis conducted on geographies consisting of 67,879,761 people shows a substantial positive correlation between the proportion of Cree and unemployment rate among women with children between the ages 6 and 17 in the United States with a correlation coefficient (R) of 0.537 and weighted average of 10.8%. Similarly, the statistical analysis conducted on geographies consisting of 134,337,989 people shows a poor positive correlation between the proportion of Immigrants from Austria and unemployment rate among women with children between the ages 6 and 17 in the United States with a correlation coefficient (R) of 0.129 and weighted average of 8.8%, a difference of 23.3%.
Unemployment Among Women with Children Ages 6 to 17 years Correlation Summary
| Measurement | Cree | Immigrants from Austria |
| Minimum | 8.1% | 4.0% |
| Maximum | 59.3% | 62.0% |
| Range | 51.3% | 58.0% |
| Mean | 29.4% | 18.6% |
| Median | 31.6% | 11.2% |
| Interquartile 25% (IQ1) | 11.9% | 8.6% |
| Interquartile 75% (IQ3) | 42.3% | 22.8% |
| Interquartile Range (IQR) | 30.4% | 14.2% |
| Standard Deviation (Sample) | 16.9% | 16.2% |
| Standard Deviation (Population) | 16.2% | 15.8% |
Similar Demographics by Unemployment Among Women with Children Ages 6 to 17 years
Demographics Similar to Cree by Unemployment Among Women with Children Ages 6 to 17 years
In terms of unemployment among women with children ages 6 to 17 years, the demographic groups most similar to Cree are Dominican (10.8%, a difference of 0.050%), Immigrants from Dominican Republic (10.8%, a difference of 0.11%), Cajun (10.8%, a difference of 0.29%), Liberian (10.8%, a difference of 0.36%), and Cape Verdean (10.9%, a difference of 0.43%).
| Demographics | Rating | Rank | Unemployment Among Women with Children Ages 6 to 17 years |
| Bahamians | 0.0 /100 | #315 | Tragic 10.4% |
| Immigrants | Dominica | 0.0 /100 | #316 | Tragic 10.5% |
| Bermudans | 0.0 /100 | #317 | Tragic 10.5% |
| Delaware | 0.0 /100 | #318 | Tragic 10.5% |
| Immigrants | Uganda | 0.0 /100 | #319 | Tragic 10.7% |
| Apache | 0.0 /100 | #320 | Tragic 10.7% |
| Tohono O'odham | 0.0 /100 | #321 | Tragic 10.7% |
| Cree | 0.0 /100 | #322 | Tragic 10.8% |
| Dominicans | 0.0 /100 | #323 | Tragic 10.8% |
| Immigrants | Dominican Republic | 0.0 /100 | #324 | Tragic 10.8% |
| Cajuns | 0.0 /100 | #325 | Tragic 10.8% |
| Liberians | 0.0 /100 | #326 | Tragic 10.8% |
| Cape Verdeans | 0.0 /100 | #327 | Tragic 10.9% |
| Ottawa | 0.0 /100 | #328 | Tragic 10.9% |
| Pennsylvania Germans | 0.0 /100 | #329 | Tragic 11.0% |
Demographics Similar to Immigrants from Austria by Unemployment Among Women with Children Ages 6 to 17 years
In terms of unemployment among women with children ages 6 to 17 years, the demographic groups most similar to Immigrants from Austria are Serbian (8.8%, a difference of 0.020%), Immigrants from Poland (8.8%, a difference of 0.080%), Immigrants from Kenya (8.8%, a difference of 0.13%), Russian (8.8%, a difference of 0.16%), and Kenyan (8.8%, a difference of 0.18%).
| Demographics | Rating | Rank | Unemployment Among Women with Children Ages 6 to 17 years |
| Europeans | 90.6 /100 | #135 | Exceptional 8.7% |
| Immigrants | Latvia | 90.4 /100 | #136 | Exceptional 8.7% |
| Immigrants | Argentina | 90.0 /100 | #137 | Excellent 8.7% |
| Immigrants | Ethiopia | 89.5 /100 | #138 | Excellent 8.8% |
| Northern Europeans | 89.2 /100 | #139 | Excellent 8.8% |
| Immigrants | Poland | 88.3 /100 | #140 | Excellent 8.8% |
| Serbians | 87.6 /100 | #141 | Excellent 8.8% |
| Immigrants | Austria | 87.5 /100 | #142 | Excellent 8.8% |
| Immigrants | Kenya | 86.1 /100 | #143 | Excellent 8.8% |
| Russians | 85.8 /100 | #144 | Excellent 8.8% |
| Kenyans | 85.6 /100 | #145 | Excellent 8.8% |
| Chileans | 80.8 /100 | #146 | Excellent 8.8% |
| Immigrants | Bangladesh | 79.4 /100 | #147 | Good 8.8% |
| Costa Ricans | 77.0 /100 | #148 | Good 8.8% |
| Croatians | 76.0 /100 | #149 | Good 8.8% |