Cree vs Cajun Disability Age 35 to 64
COMPARE
Cree
Cajun
Disability Age 35 to 64
Disability Age 35 to 64 Comparison
Cree
Cajuns
14.1%
DISABILITY AGE 35 TO 64
0.0/ 100
METRIC RATING
309th/ 347
METRIC RANK
15.3%
DISABILITY AGE 35 TO 64
0.0/ 100
METRIC RATING
328th/ 347
METRIC RANK
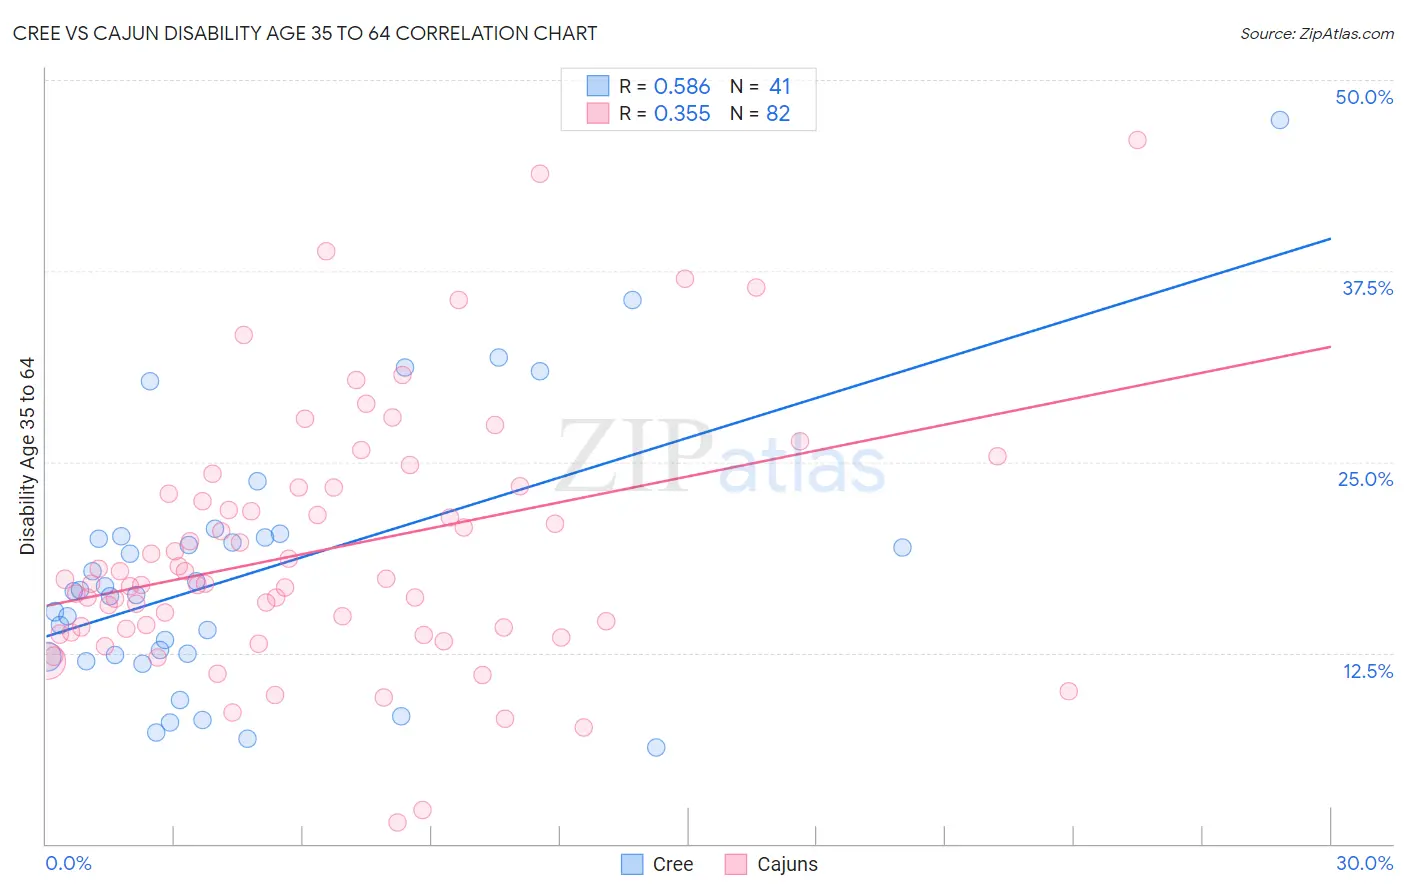
Cree vs Cajun Disability Age 35 to 64 Correlation Chart
The statistical analysis conducted on geographies consisting of 76,205,381 people shows a substantial positive correlation between the proportion of Cree and percentage of population with a disability between the ages 34 and 64 in the United States with a correlation coefficient (R) of 0.586 and weighted average of 14.1%. Similarly, the statistical analysis conducted on geographies consisting of 149,686,852 people shows a mild positive correlation between the proportion of Cajuns and percentage of population with a disability between the ages 34 and 64 in the United States with a correlation coefficient (R) of 0.355 and weighted average of 15.3%, a difference of 9.0%.
Disability Age 35 to 64 Correlation Summary
| Measurement | Cree | Cajun |
| Minimum | 6.3% | 1.4% |
| Maximum | 47.4% | 46.1% |
| Range | 41.1% | 44.7% |
| Mean | 17.7% | 19.2% |
| Median | 16.5% | 17.2% |
| Interquartile 25% (IQ1) | 12.3% | 14.1% |
| Interquartile 75% (IQ3) | 20.1% | 23.3% |
| Interquartile Range (IQR) | 7.8% | 9.2% |
| Standard Deviation (Sample) | 8.6% | 8.4% |
| Standard Deviation (Population) | 8.5% | 8.3% |
Demographics Similar to Cree and Cajuns by Disability Age 35 to 64
In terms of disability age 35 to 64, the demographic groups most similar to Cree are Inupiat (14.1%, a difference of 0.070%), Cape Verdean (14.1%, a difference of 0.47%), Immigrants from the Azores (14.3%, a difference of 1.4%), Paiute (14.3%, a difference of 1.5%), and Iroquois (14.4%, a difference of 2.0%). Similarly, the demographic groups most similar to Cajuns are Pueblo (15.3%, a difference of 0.18%), Native/Alaskan (15.3%, a difference of 0.20%), Arapaho (15.1%, a difference of 1.8%), Chippewa (15.0%, a difference of 2.5%), and Apache (14.9%, a difference of 2.7%).
| Demographics | Rating | Rank | Disability Age 35 to 64 |
| Inupiat | 0.0 /100 | #308 | Tragic 14.1% |
| Cree | 0.0 /100 | #309 | Tragic 14.1% |
| Cape Verdeans | 0.0 /100 | #310 | Tragic 14.1% |
| Immigrants | Azores | 0.0 /100 | #311 | Tragic 14.3% |
| Paiute | 0.0 /100 | #312 | Tragic 14.3% |
| Iroquois | 0.0 /100 | #313 | Tragic 14.4% |
| Shoshone | 0.0 /100 | #314 | Tragic 14.5% |
| Alaska Natives | 0.0 /100 | #315 | Tragic 14.5% |
| Osage | 0.0 /100 | #316 | Tragic 14.5% |
| Crow | 0.0 /100 | #317 | Tragic 14.6% |
| Ottawa | 0.0 /100 | #318 | Tragic 14.6% |
| Immigrants | Cabo Verde | 0.0 /100 | #319 | Tragic 14.7% |
| Blacks/African Americans | 0.0 /100 | #320 | Tragic 14.7% |
| Comanche | 0.0 /100 | #321 | Tragic 14.7% |
| Potawatomi | 0.0 /100 | #322 | Tragic 14.8% |
| Apache | 0.0 /100 | #323 | Tragic 14.9% |
| Chippewa | 0.0 /100 | #324 | Tragic 15.0% |
| Arapaho | 0.0 /100 | #325 | Tragic 15.1% |
| Natives/Alaskans | 0.0 /100 | #326 | Tragic 15.3% |
| Pueblo | 0.0 /100 | #327 | Tragic 15.3% |
| Cajuns | 0.0 /100 | #328 | Tragic 15.3% |