Comanche vs Serbian Unemployment Among Ages 30 to 34 years
COMPARE
Comanche
Serbian
Unemployment Among Ages 30 to 34 years
Unemployment Among Ages 30 to 34 years Comparison
Comanche
Serbians
6.3%
UNEMPLOYMENT AMONG AGES 30 TO 34 YEARS
0.0/ 100
METRIC RATING
271st/ 347
METRIC RANK
5.4%
UNEMPLOYMENT AMONG AGES 30 TO 34 YEARS
72.9/ 100
METRIC RATING
138th/ 347
METRIC RANK
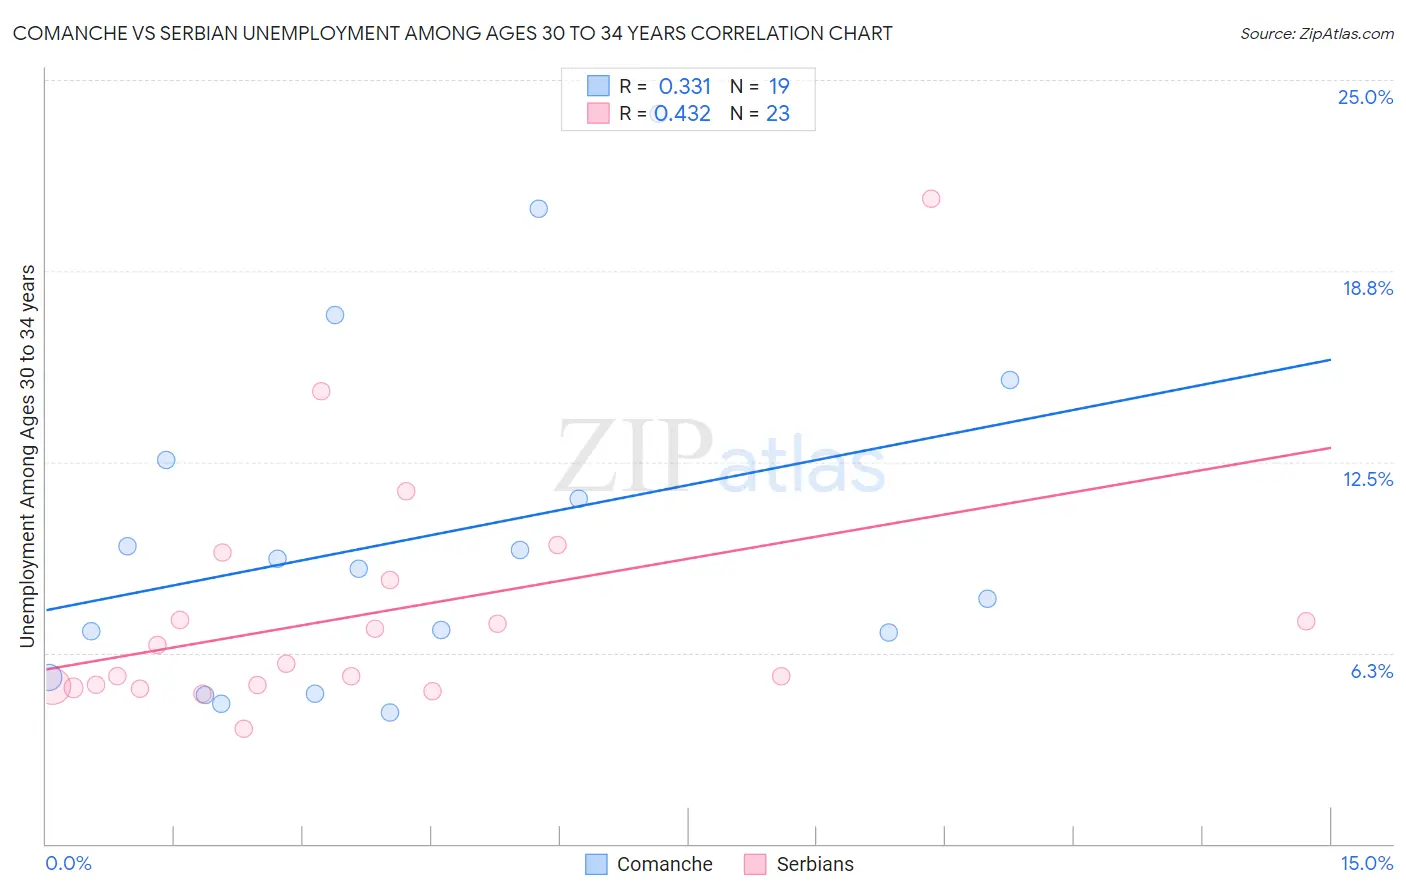
Comanche vs Serbian Unemployment Among Ages 30 to 34 years Correlation Chart
The statistical analysis conducted on geographies consisting of 107,264,456 people shows a mild positive correlation between the proportion of Comanche and unemployment rate among population between the ages 30 and 34 in the United States with a correlation coefficient (R) of 0.331 and weighted average of 6.3%. Similarly, the statistical analysis conducted on geographies consisting of 254,966,443 people shows a moderate positive correlation between the proportion of Serbians and unemployment rate among population between the ages 30 and 34 in the United States with a correlation coefficient (R) of 0.432 and weighted average of 5.4%, a difference of 16.8%.
Unemployment Among Ages 30 to 34 years Correlation Summary
| Measurement | Comanche | Serbian |
| Minimum | 4.3% | 3.8% |
| Maximum | 23.9% | 21.1% |
| Range | 19.6% | 17.3% |
| Mean | 10.1% | 7.5% |
| Median | 9.0% | 5.9% |
| Interquartile 25% (IQ1) | 5.4% | 5.2% |
| Interquartile 75% (IQ3) | 12.6% | 8.6% |
| Interquartile Range (IQR) | 7.1% | 3.5% |
| Standard Deviation (Sample) | 5.6% | 3.9% |
| Standard Deviation (Population) | 5.5% | 3.8% |
Similar Demographics by Unemployment Among Ages 30 to 34 years
Demographics Similar to Comanche by Unemployment Among Ages 30 to 34 years
In terms of unemployment among ages 30 to 34 years, the demographic groups most similar to Comanche are Blackfeet (6.3%, a difference of 0.11%), Ottawa (6.3%, a difference of 0.12%), U.S. Virgin Islander (6.3%, a difference of 0.13%), Immigrants from Senegal (6.3%, a difference of 0.19%), and French American Indian (6.3%, a difference of 0.20%).
| Demographics | Rating | Rank | Unemployment Among Ages 30 to 34 years |
| Chickasaw | 0.0 /100 | #264 | Tragic 6.2% |
| Americans | 0.0 /100 | #265 | Tragic 6.2% |
| Seminole | 0.0 /100 | #266 | Tragic 6.2% |
| Immigrants | Mexico | 0.0 /100 | #267 | Tragic 6.2% |
| Immigrants | Haiti | 0.0 /100 | #268 | Tragic 6.2% |
| French American Indians | 0.0 /100 | #269 | Tragic 6.3% |
| Immigrants | Senegal | 0.0 /100 | #270 | Tragic 6.3% |
| Comanche | 0.0 /100 | #271 | Tragic 6.3% |
| Blackfeet | 0.0 /100 | #272 | Tragic 6.3% |
| Ottawa | 0.0 /100 | #273 | Tragic 6.3% |
| U.S. Virgin Islanders | 0.0 /100 | #274 | Tragic 6.3% |
| Ecuadorians | 0.0 /100 | #275 | Tragic 6.3% |
| Pennsylvania Germans | 0.0 /100 | #276 | Tragic 6.3% |
| Immigrants | Ecuador | 0.0 /100 | #277 | Tragic 6.3% |
| Osage | 0.0 /100 | #278 | Tragic 6.3% |
Demographics Similar to Serbians by Unemployment Among Ages 30 to 34 years
In terms of unemployment among ages 30 to 34 years, the demographic groups most similar to Serbians are Lithuanian (5.4%, a difference of 0.050%), Immigrants from North America (5.4%, a difference of 0.060%), Immigrants from Europe (5.4%, a difference of 0.080%), Immigrants from Greece (5.4%, a difference of 0.080%), and Immigrants from Canada (5.4%, a difference of 0.15%).
| Demographics | Rating | Rank | Unemployment Among Ages 30 to 34 years |
| Immigrants | Eastern Europe | 77.4 /100 | #131 | Good 5.3% |
| Carpatho Rusyns | 77.3 /100 | #132 | Good 5.3% |
| Immigrants | Northern Europe | 77.3 /100 | #133 | Good 5.3% |
| Bangladeshis | 76.6 /100 | #134 | Good 5.3% |
| Palestinians | 75.1 /100 | #135 | Good 5.4% |
| Pakistanis | 74.6 /100 | #136 | Good 5.4% |
| Immigrants | Canada | 74.6 /100 | #137 | Good 5.4% |
| Serbians | 72.9 /100 | #138 | Good 5.4% |
| Lithuanians | 72.4 /100 | #139 | Good 5.4% |
| Immigrants | North America | 72.2 /100 | #140 | Good 5.4% |
| Immigrants | Europe | 72.1 /100 | #141 | Good 5.4% |
| Immigrants | Greece | 72.0 /100 | #142 | Good 5.4% |
| Russians | 71.1 /100 | #143 | Good 5.4% |
| Immigrants | Russia | 71.0 /100 | #144 | Good 5.4% |
| Syrians | 70.3 /100 | #145 | Good 5.4% |